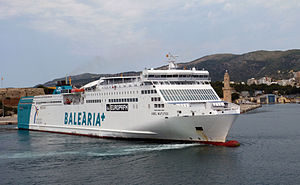
Abel Matutes

2 to 4 times an average plane's emissions
(based on 2022 data)
Often travels on 1 routes
- Barcelone [ES] ↔ Palma [ES] - 206 km
⚠️
Do you know of a route that this ship frequently travels but is not listed? Or have you noticed an error?
Please help by letting us know, thank you 🙇🏽♀️
Please help by letting us know, thank you 🙇🏽♀️
Ship Statistics
| 2022 yearly CO₂ Emissions | |||
|---|---|---|---|
| assigned to | total | average | ratio |
| persons 🙎♀️ | 3752 tonnes CO₂ | 577 g·CO₂/pax/n.mile | 10 % ⚙️ |
| freight 🚛 | 33329 tonnes CO₂ | 318 kg·CO₂/m tonne/n.mile | 90 % ⚙️ |
| total | 38755 tonnes CO₂ | 485 kg·CO₂/n.mile | 100% |
| 2022 yearly statistics | |
|---|---|
| distance travelled | 148076 km ⚙️ |
| time at sea | 4777 hours |
| 2022 average statistics per journey | |
|---|---|
| average persons transported 🙎♀️ | 81 persons ⚙️ |
| average freight transported 🚛 | 1310 metric tons ⚙️ |
| average speed | 31 km/h ⚙️ |
2022 monitoring methods:
N/A
2022 Theoretical
EIV (Efficiency Indicator Values): 15.1 gCO₂/ton/nautical mile
﹖ details
| 2021 yearly CO₂ Emissions | |||
|---|---|---|---|
| assigned to | total | average | ratio |
| persons 🙎♀️ | 2271 tonnes CO₂ | 262 g·CO₂/pax/n.mile | 6 % ⚙️ |
| freight 🚛 | 33088 tonnes CO₂ | 183 kg·CO₂/m tonne/n.mile | 94 % ⚙️ |
| total | 38170 tonnes CO₂ | 430 kg·CO₂/n.mile | 100% |
| 2021 yearly statistics | |
|---|---|
| distance travelled | 164487 km ⚙️ |
| time at sea | 6091 hours |
| 2021 average statistics per journey | |
|---|---|
| average persons transported 🙎♀️ | 98 persons ⚙️ |
| average freight transported 🚛 | 2031 metric tons ⚙️ |
| average speed | 27 km/h ⚙️ |
2021 monitoring methods:
N/A
2021 Theoretical
EIV (Efficiency Indicator Values): 15.1 gCO₂/ton/nautical mile
﹖ details
| 2020 yearly CO₂ Emissions | |||
|---|---|---|---|
| assigned to | total | average | ratio |
| persons 🙎♀️ | 2687 tonnes CO₂ | 352 g·CO₂/pax/n.mile | 8 % ⚙️ |
| freight 🚛 | 26880 tonnes CO₂ | 196 kg·CO₂/m tonne/n.mile | 92 % ⚙️ |
| total | 32408 tonnes CO₂ | 413 kg·CO₂/n.mile | 100% |
| 2020 yearly statistics | |
|---|---|
| distance travelled | 145215 km ⚙️ |
| time at sea | 4740 hours |
| 2020 average statistics per journey | |
|---|---|
| average persons transported 🙎♀️ | 97 persons ⚙️ |
| average freight transported 🚛 | 1748 metric tons ⚙️ |
| average speed | 31 km/h ⚙️ |
2020 monitoring methods:
N/A
2020 Theoretical
EIV (Efficiency Indicator Values): 15.1 gCO₂/ton/nautical mile
﹖ details
| 2019 yearly CO₂ Emissions | |||
|---|---|---|---|
| assigned to | total | average | ratio |
| persons 🙎♀️ | 1999 tonnes CO₂ | 4754 g·CO₂/pax/n.mile | 6 % ⚙️ |
| freight 🚛 | 29836 tonnes CO₂ | 4754 kg·CO₂/m tonne/n.mile | 94 % ⚙️ |
| total | 34468 tonnes CO₂ | 606 kg·CO₂/n.mile | 100% |
| 2019 yearly statistics | |
|---|---|
| distance travelled | 105406 km ⚙️ |
| time at sea | 3178 hours |
| 2019 average statistics per journey | |
|---|---|
| average persons transported 🙎♀️ | 7 persons ⚙️ |
| average freight transported 🚛 | 110 metric tons ⚙️ |
| average speed | 33 km/h ⚙️ |
2019 monitoring methods:
N/A
2019 Theoretical
EIV (Efficiency Indicator Values): 15.1 gCO₂/ton/nautical mile
﹖ details
| 2018 yearly CO₂ Emissions | |||
|---|---|---|---|
| assigned to | total | average | ratio |
| persons 🙎♀️ | 1425 tonnes CO₂ | 2362 g·CO₂/pax/n.mile | 3 % ⚙️ |
| freight 🚛 | 46541 tonnes CO₂ | 2358 kg·CO₂/m tonne/n.mile | 97 % ⚙️ |
| total | 47965 tonnes CO₂ | 501 kg·CO₂/n.mile | 100% |
| 2018 yearly statistics | |
|---|---|
| distance travelled | 177139 km ⚙️ |
| time at sea | 4754 hours |
| 2018 average statistics per journey | |
|---|---|
| average persons transported 🙎♀️ | 6 persons ⚙️ |
| average freight transported 🚛 | 206 metric tons ⚙️ |
| average speed | 37 km/h ⚙️ |
2018 monitoring methods:
N/A
2018 Theoretical
EIV (Efficiency Indicator Values): 15.1 gCO₂/ton/nautical mile
﹖ details
ℹ️
Figures with the icon ⚙️ were computed based on the published data.
You can find computation details on
this page ↗
GreenFerries is a hobby project, all the data shown here has no official value. It is Open Source, so you can double check and modify it.

The Ecoscore compares
average CO₂ emissions per passenger per km.
‟emits like 2.1 planes” means that the ferry emits more than twice what an average plane would on the same distance for one passenger.