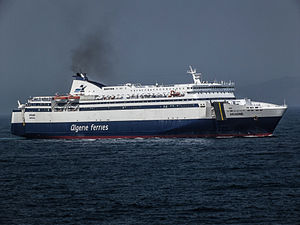
Ariadne

better than riding a car with a single passenger
(based on 2022 data)
Often travels on 2 routes
- Naples [IT] ↔ Cagliari [IT] - 474 km
- Naples [IT] ↔ Palerme [IT] - 313 km
⚠️
Do you know of a route that this ship frequently travels but is not listed? Or have you noticed an error?
Please help by letting us know, thank you 🙇🏽♀️
Please help by letting us know, thank you 🙇🏽♀️
Ship Statistics
| 2022 yearly CO₂ Emissions | |||
|---|---|---|---|
| assigned to | total | average | ratio |
| persons 🙎♀️ | 8390 tonnes CO₂ | 236 g·CO₂/pax/n.mile | 12 % ⚙️ |
| freight 🚛 | 60943 tonnes CO₂ | 311 kg·CO₂/m tonne/n.mile | 88 % ⚙️ |
| total | 69333 tonnes CO₂ | 695 kg·CO₂/n.mile | 100% |
| 2022 yearly statistics | |
|---|---|
| distance travelled | 184834 km ⚙️ |
| time at sea | 5031 hours |
| 2022 average statistics per journey | |
|---|---|
| average persons transported 🙎♀️ | 356 persons ⚙️ |
| average freight transported 🚛 | 1961 metric tons ⚙️ |
| average speed | 37 km/h ⚙️ |
2022 monitoring methods:
N/A
2022 Theoretical
EIV (Efficiency Indicator Values): 39.15 gCO₂/ton/nautical mile
﹖ details
| 2021 yearly CO₂ Emissions | |||
|---|---|---|---|
| assigned to | total | average | ratio |
| persons 🙎♀️ | 5405 tonnes CO₂ | 269 g·CO₂/pax/n.mile | 16 % ⚙️ |
| freight 🚛 | 28414 tonnes CO₂ | 293 kg·CO₂/m tonne/n.mile | 84 % ⚙️ |
| total | 33819 tonnes CO₂ | 660 kg·CO₂/n.mile | 100% |
| 2021 yearly statistics | |
|---|---|
| distance travelled | 94840 km ⚙️ |
| time at sea | 2514 hours |
| 2021 average statistics per journey | |
|---|---|
| average persons transported 🙎♀️ | 393 persons ⚙️ |
| average freight transported 🚛 | 1897 metric tons ⚙️ |
| average speed | 38 km/h ⚙️ |
2021 monitoring methods:
N/A
2021 Theoretical
EIV (Efficiency Indicator Values): 39.15 gCO₂/ton/nautical mile
﹖ details
| 2020 yearly CO₂ Emissions | |||
|---|---|---|---|
| assigned to | total | average | ratio |
| persons 🙎♀️ | 3938 tonnes CO₂ | 260 g·CO₂/pax/n.mile | 9 % ⚙️ |
| freight 🚛 | 41059 tonnes CO₂ | 389 kg·CO₂/m tonne/n.mile | 91 % ⚙️ |
| total | 44997 tonnes CO₂ | 561 kg·CO₂/n.mile | 100% |
| 2020 yearly statistics | |
|---|---|
| distance travelled | 148552 km ⚙️ |
| time at sea | 4127 hours |
| 2020 average statistics per journey | |
|---|---|
| average persons transported 🙎♀️ | 189 persons ⚙️ |
| average freight transported 🚛 | 1317 metric tons ⚙️ |
| average speed | 36 km/h ⚙️ |
2020 monitoring methods:
N/A
2020 Theoretical
EIV (Efficiency Indicator Values): 39.15 gCO₂/ton/nautical mile
﹖ details
| 2019 yearly CO₂ Emissions | |||
|---|---|---|---|
| assigned to | total | average | ratio |
| persons 🙎♀️ | 6779 tonnes CO₂ | 224 g·CO₂/pax/n.mile | 14 % ⚙️ |
| freight 🚛 | 42727 tonnes CO₂ | 355 kg·CO₂/m tonne/n.mile | 86 % ⚙️ |
| total | 49505 tonnes CO₂ | 582 kg·CO₂/n.mile | 100% |
| 2019 yearly statistics | |
|---|---|
| distance travelled | 157473 km ⚙️ |
| time at sea | 4352 hours |
| 2019 average statistics per journey | |
|---|---|
| average persons transported 🙎♀️ | 356 persons ⚙️ |
| average freight transported 🚛 | 1416 metric tons ⚙️ |
| average speed | 36 km/h ⚙️ |
2019 monitoring methods:
N/A
2019 Theoretical
EIV (Efficiency Indicator Values): 39.15 gCO₂/ton/nautical mile
﹖ details
| 2018 yearly CO₂ Emissions | |||
|---|---|---|---|
| assigned to | total | average | ratio |
| persons 🙎♀️ | 7126 tonnes CO₂ | 218 g·CO₂/pax/n.mile | 17 % ⚙️ |
| freight 🚛 | 35090 tonnes CO₂ | 367 kg·CO₂/m tonne/n.mile | 83 % ⚙️ |
| total | 42216 tonnes CO₂ | 583 kg·CO₂/n.mile | 100% |
| 2018 yearly statistics | |
|---|---|
| distance travelled | 134144 km ⚙️ |
| time at sea | 3657 hours |
| 2018 average statistics per journey | |
|---|---|
| average persons transported 🙎♀️ | 452 persons ⚙️ |
| average freight transported 🚛 | 1319 metric tons ⚙️ |
| average speed | 37 km/h ⚙️ |
2018 monitoring methods:
N/A
2018 Theoretical
EIV (Efficiency Indicator Values): 39.15 gCO₂/ton/nautical mile
﹖ details
ℹ️
Figures with the icon ⚙️ were computed based on the published data.
You can find computation details on
this page ↗
GreenFerries is a hobby project, all the data shown here has no official value. It is Open Source, so you can double check and modify it.

The Ecoscore compares
average CO₂ emissions per passenger per km.
‟emits like 2.1 planes” means that the ferry emits more than twice what an average plane would on the same distance for one passenger.