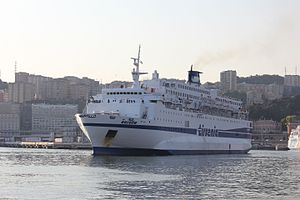
Aurelia

2 to 4 times an average plane's emissions
(based on 2022 data)
Often travels on 1 routes
- Ancona [IT] ↔ Split [HR] - 236 km
⚠️
Do you know of a route that this ship frequently travels but is not listed? Or have you noticed an error?
Please help by letting us know, thank you 🙇🏽♀️
Please help by letting us know, thank you 🙇🏽♀️
Ship Statistics
| 2022 yearly CO₂ Emissions | |||
|---|---|---|---|
| assigned to | total | average | ratio |
| persons 🙎♀️ | 3581 tonnes CO₂ | 1041 g·CO₂/pax/n.mile | 53 % ⚙️ |
| freight 🚛 | 3176 tonnes CO₂ | 3348 kg·CO₂/m tonne/n.mile | 47 % ⚙️ |
| total | 6757 tonnes CO₂ | 586 kg·CO₂/n.mile | 100% |
| 2022 yearly statistics | |
|---|---|
| distance travelled | 21363 km ⚙️ |
| time at sea | 1936 hours |
| 2022 average statistics per journey | |
|---|---|
| average persons transported 🙎♀️ | 298 persons ⚙️ |
| average freight transported 🚛 | 82 metric tons ⚙️ |
| average speed | 11 km/h ⚙️ |
2022 monitoring methods:
N/A
2022 Theoretical
EIV (Efficiency Indicator Values): 38.12 gCO₂/ton/nautical mile
﹖ details
| 2021 yearly CO₂ Emissions | |||
|---|---|---|---|
| assigned to | total | average | ratio |
| persons 🙎♀️ | 7582 tonnes CO₂ | 1364 g·CO₂/pax/n.mile | 53 % ⚙️ |
| freight 🚛 | 6724 tonnes CO₂ | 1145 kg·CO₂/m tonne/n.mile | 47 % ⚙️ |
| total | 14305 tonnes CO₂ | 508 kg·CO₂/n.mile | 100% |
| 2021 yearly statistics | |
|---|---|
| distance travelled | 52194 km ⚙️ |
| time at sea | 3791 hours |
| 2021 average statistics per journey | |
|---|---|
| average persons transported 🙎♀️ | 197 persons ⚙️ |
| average freight transported 🚛 | 208 metric tons ⚙️ |
| average speed | 14 km/h ⚙️ |
2021 monitoring methods:
N/A
2021 Theoretical
EIV (Efficiency Indicator Values): 38.12 gCO₂/ton/nautical mile
﹖ details
| 2020 yearly CO₂ Emissions | |||
|---|---|---|---|
| assigned to | total | average | ratio |
| persons 🙎♀️ | 4572 tonnes CO₂ | 1277 g·CO₂/pax/n.mile | 53 % ⚙️ |
| freight 🚛 | 4055 tonnes CO₂ | 559 kg·CO₂/m tonne/n.mile | 47 % ⚙️ |
| total | 8627 tonnes CO₂ | 496 kg·CO₂/n.mile | 100% |
| 2020 yearly statistics | |
|---|---|
| distance travelled | 32213 km ⚙️ |
| time at sea | 3048 hours |
| 2020 average statistics per journey | |
|---|---|
| average persons transported 🙎♀️ | 206 persons ⚙️ |
| average freight transported 🚛 | 417 metric tons ⚙️ |
| average speed | 11 km/h ⚙️ |
2020 monitoring methods:
N/A
2020 Theoretical
EIV (Efficiency Indicator Values): 31.4 gCO₂/ton/nautical mile
﹖ details
| 2019 yearly CO₂ Emissions | |||
|---|---|---|---|
| assigned to | total | average | ratio |
| persons 🙎♀️ | 6045 tonnes CO₂ | 351 g·CO₂/pax/n.mile | 53 % ⚙️ |
| freight 🚛 | 5361 tonnes CO₂ | 352 kg·CO₂/m tonne/n.mile | 47 % ⚙️ |
| total | 11406 tonnes CO₂ | 437 kg·CO₂/n.mile | 100% |
| 2019 yearly statistics | |
|---|---|
| distance travelled | 48295 km ⚙️ |
| time at sea | 2567 hours |
| 2019 average statistics per journey | |
|---|---|
| average persons transported 🙎♀️ | 660 persons ⚙️ |
| average freight transported 🚛 | 583 metric tons ⚙️ |
| average speed | 19 km/h ⚙️ |
2019 monitoring methods:
N/A
2019 Theoretical
EIV (Efficiency Indicator Values): 42 gCO₂/ton/nautical mile
﹖ details
| 2018 yearly CO₂ Emissions | |||
|---|---|---|---|
| assigned to | total | average | ratio |
| persons 🙎♀️ | 10726 tonnes CO₂ | 768 g·CO₂/pax/n.mile | 93 % ⚙️ |
| freight 🚛 | 807 tonnes CO₂ | 83 kg·CO₂/m tonne/n.mile | 7 % ⚙️ |
| total | 11533 tonnes CO₂ | 405 kg·CO₂/n.mile | 100% |
| 2018 yearly statistics | |
|---|---|
| distance travelled | 52711 km ⚙️ |
| time at sea | 2196 hours |
| 2018 average statistics per journey | |
|---|---|
| average persons transported 🙎♀️ | 491 persons ⚙️ |
| average freight transported 🚛 | 340 metric tons ⚙️ |
| average speed | 24 km/h ⚙️ |
2018 monitoring methods:
N/A
2018 Theoretical
EIV (Efficiency Indicator Values): 21 gCO₂/ton/nautical mile
﹖ details
ℹ️
Figures with the icon ⚙️ were computed based on the published data.
You can find computation details on
this page ↗
GreenFerries is a hobby project, all the data shown here has no official value. It is Open Source, so you can double check and modify it.

The Ecoscore compares
average CO₂ emissions per passenger per km.
‟emits like 2.1 planes” means that the ferry emits more than twice what an average plane would on the same distance for one passenger.