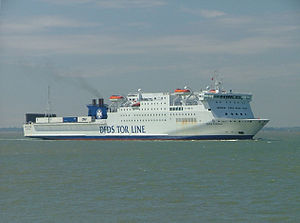
Baie de Seine

2 to 4 times an average plane's emissions
(based on 2022 data)
Often travels on 1 routes
- Le Havre [FR] ↔ Portsmouth [GB] - 170 km
⚠️
Do you know of a route that this ship frequently travels but is not listed? Or have you noticed an error?
Please help by letting us know, thank you 🙇🏽♀️
Please help by letting us know, thank you 🙇🏽♀️
Ship Statistics
| 2022 yearly CO₂ Emissions | |||
|---|---|---|---|
| assigned to | total | average | ratio |
| persons 🙎♀️ | 8858 tonnes CO₂ | 720 g·CO₂/pax/n.mile | 38 % ⚙️ |
| freight 🚛 | 14601 tonnes CO₂ | 100 kg·CO₂/m tonne/n.mile | 62 % ⚙️ |
| total | 23459 tonnes CO₂ | 320 kg·CO₂/n.mile | 100% |
| 2022 yearly statistics | |
|---|---|
| distance travelled | 135727 km ⚙️ |
| time at sea | 4772 hours |
| 2022 average statistics per journey | |
|---|---|
| average persons transported 🙎♀️ | 168 persons ⚙️ |
| average freight transported 🚛 | 1993 metric tons ⚙️ |
| average speed | 28 km/h ⚙️ |
2022 monitoring methods:
N/A
2022 Theoretical
EIV (Efficiency Indicator Values): 26.17 gCO₂/ton/nautical mile
﹖ details
| 2021 yearly CO₂ Emissions | |||
|---|---|---|---|
| assigned to | total | average | ratio |
| persons 🙎♀️ | 13076 tonnes CO₂ | 910 g·CO₂/pax/n.mile | 41 % ⚙️ |
| freight 🚛 | 18817 tonnes CO₂ | 116 kg·CO₂/m tonne/n.mile | 59 % ⚙️ |
| total | 31892 tonnes CO₂ | 336 kg·CO₂/n.mile | 100% |
| 2021 yearly statistics | |
|---|---|
| distance travelled | 176008 km ⚙️ |
| time at sea | 5925 hours |
| 2021 average statistics per journey | |
|---|---|
| average persons transported 🙎♀️ | 151 persons ⚙️ |
| average freight transported 🚛 | 1713 metric tons ⚙️ |
| average speed | 30 km/h ⚙️ |
2021 monitoring methods:
N/A
2021 Theoretical
EIV (Efficiency Indicator Values): 27.35 gCO₂/ton/nautical mile
﹖ details
| 2020 yearly CO₂ Emissions | |||
|---|---|---|---|
| assigned to | total | average | ratio |
| persons 🙎♀️ | 8405 tonnes CO₂ | 1049 g·CO₂/pax/n.mile | 32 % ⚙️ |
| freight 🚛 | 18054 tonnes CO₂ | 204 kg·CO₂/m tonne/n.mile | 68 % ⚙️ |
| total | 26460 tonnes CO₂ | 381 kg·CO₂/n.mile | 100% |
| 2020 yearly statistics | |
|---|---|
| distance travelled | 128550 km ⚙️ |
| time at sea | 4268 hours |
| 2020 average statistics per journey | |
|---|---|
| average persons transported 🙎♀️ | 115 persons ⚙️ |
| average freight transported 🚛 | 1278 metric tons ⚙️ |
| average speed | 30 km/h ⚙️ |
2020 monitoring methods:
N/A
2020 Theoretical
EIV (Efficiency Indicator Values): 27.35 gCO₂/ton/nautical mile
﹖ details
| 2019 yearly CO₂ Emissions | |||
|---|---|---|---|
| assigned to | total | average | ratio |
| persons 🙎♀️ | 6762 tonnes CO₂ | 210 g·CO₂/pax/n.mile | 15 % ⚙️ |
| freight 🚛 | 37369 tonnes CO₂ | 208 kg·CO₂/m tonne/n.mile | 85 % ⚙️ |
| total | 44132 tonnes CO₂ | 421 kg·CO₂/n.mile | 100% |
| 2019 yearly statistics | |
|---|---|
| distance travelled | 194183 km ⚙️ |
| time at sea | 5902 hours |
| 2019 average statistics per journey | |
|---|---|
| average persons transported 🙎♀️ | 308 persons ⚙️ |
| average freight transported 🚛 | 1713 metric tons ⚙️ |
| average speed | 33 km/h ⚙️ |
2019 monitoring methods:
N/A
2019 Theoretical
EIV (Efficiency Indicator Values): 27.35 gCO₂/ton/nautical mile
﹖ details
| 2018 yearly CO₂ Emissions | |||
|---|---|---|---|
| assigned to | total | average | ratio |
| persons 🙎♀️ | 6705 tonnes CO₂ | 195 g·CO₂/pax/n.mile | 15 % ⚙️ |
| freight 🚛 | 39513 tonnes CO₂ | 194 kg·CO₂/m tonne/n.mile | 85 % ⚙️ |
| total | 46218 tonnes CO₂ | 408 kg·CO₂/n.mile | 100% |
| 2018 yearly statistics | |
|---|---|
| distance travelled | 209777 km ⚙️ |
| time at sea | 6640 hours |
| 2018 average statistics per journey | |
|---|---|
| average persons transported 🙎♀️ | 303 persons ⚙️ |
| average freight transported 🚛 | 1800 metric tons ⚙️ |
| average speed | 32 km/h ⚙️ |
2018 monitoring methods:
N/A
2018 Theoretical
EIV (Efficiency Indicator Values): 27.35 gCO₂/ton/nautical mile
﹖ details
ℹ️
Figures with the icon ⚙️ were computed based on the published data.
You can find computation details on
this page ↗
GreenFerries is a hobby project, all the data shown here has no official value. It is Open Source, so you can double check and modify it.

The Ecoscore compares
average CO₂ emissions per passenger per km.
‟emits like 2.1 planes” means that the ferry emits more than twice what an average plane would on the same distance for one passenger.