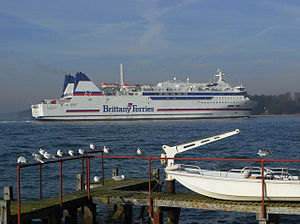
Barfleur

over 4 times an average plane's emissions
(based on 2022 data)
Often travels on 1 routes
- Cherbourg [FR] ↔ Poole [GB] - 120 km
⚠️
Do you know of a route that this ship frequently travels but is not listed? Or have you noticed an error?
Please help by letting us know, thank you 🙇🏽♀️
Please help by letting us know, thank you 🙇🏽♀️
Ship Statistics
| 2022 yearly CO₂ Emissions | |||
|---|---|---|---|
| assigned to | total | average | ratio |
| persons 🙎♀️ | 15410 tonnes CO₂ | 1452 g·CO₂/pax/n.mile | 81 % ⚙️ |
| freight 🚛 | 3546 tonnes CO₂ | 120 kg·CO₂/m tonne/n.mile | 19 % ⚙️ |
| total | 18955 tonnes CO₂ | 433 kg·CO₂/n.mile | 100% |
| 2022 yearly statistics | |
|---|---|
| distance travelled | 81161 km ⚙️ |
| time at sea | 3242 hours |
| 2022 average statistics per journey | |
|---|---|
| average persons transported 🙎♀️ | 242 persons ⚙️ |
| average freight transported 🚛 | 673 metric tons ⚙️ |
| average speed | 25 km/h ⚙️ |
2022 monitoring methods:
N/A
2022 Theoretical
EIV (Efficiency Indicator Values): 30.28 gCO₂/ton/nautical mile
﹖ details
| 2021 yearly CO₂ Emissions | |||
|---|---|---|---|
| assigned to | total | average | ratio |
| persons 🙎♀️ | N/A | N/A | N/A |
| freight 🚛 | N/A | N/A | 100 % ⚙️ |
| total | 3396 tonnes CO₂ | N/A | 100% |
| 2021 yearly statistics | |
|---|---|
| distance travelled | N/A |
| time at sea | N/A |
| 2021 average statistics per journey | |
|---|---|
| average persons transported 🙎♀️ | N/A |
| average freight transported 🚛 | N/A |
| average speed | N/A |
2021 monitoring methods:
N/A
2021 Theoretical
EIV (Efficiency Indicator Values): 30.28 gCO₂/ton/nautical mile
﹖ details
| 2020 yearly CO₂ Emissions | |||
|---|---|---|---|
| assigned to | total | average | ratio |
| persons 🙎♀️ | 786 tonnes CO₂ | 616 g·CO₂/pax/n.mile | 10 % ⚙️ |
| freight 🚛 | 7388 tonnes CO₂ | 710 kg·CO₂/m tonne/n.mile | 90 % ⚙️ |
| total | 8174 tonnes CO₂ | 848 kg·CO₂/n.mile | 100% |
| 2020 yearly statistics | |
|---|---|
| distance travelled | 17851 km ⚙️ |
| time at sea | 832 hours |
| 2020 average statistics per journey | |
|---|---|
| average persons transported 🙎♀️ | 132 persons ⚙️ |
| average freight transported 🚛 | 1080 metric tons ⚙️ |
| average speed | 21 km/h ⚙️ |
2020 monitoring methods:
N/A
2020 Theoretical
EIV (Efficiency Indicator Values): 30.28 gCO₂/ton/nautical mile
﹖ details
| 2019 yearly CO₂ Emissions | |||
|---|---|---|---|
| assigned to | total | average | ratio |
| persons 🙎♀️ | 5780 tonnes CO₂ | 430 g·CO₂/pax/n.mile | 23 % ⚙️ |
| freight 🚛 | 19136 tonnes CO₂ | 479 kg·CO₂/m tonne/n.mile | 77 % ⚙️ |
| total | 24916 tonnes CO₂ | 443 kg·CO₂/n.mile | 100% |
| 2019 yearly statistics | |
|---|---|
| distance travelled | 104152 km ⚙️ |
| time at sea | 5146 hours |
| 2019 average statistics per journey | |
|---|---|
| average persons transported 🙎♀️ | 239 persons ⚙️ |
| average freight transported 🚛 | 711 metric tons ⚙️ |
| average speed | 20 km/h ⚙️ |
2019 monitoring methods:
N/A
2019 Theoretical
EIV (Efficiency Indicator Values): 30.28 gCO₂/ton/nautical mile
﹖ details
| 2018 yearly CO₂ Emissions | |||
|---|---|---|---|
| assigned to | total | average | ratio |
| persons 🙎♀️ | 5520 tonnes CO₂ | 398 g·CO₂/pax/n.mile | 24 % ⚙️ |
| freight 🚛 | 17199 tonnes CO₂ | 466 kg·CO₂/m tonne/n.mile | 76 % ⚙️ |
| total | 22719 tonnes CO₂ | 531 kg·CO₂/n.mile | 100% |
| 2018 yearly statistics | |
|---|---|
| distance travelled | 79288 km ⚙️ |
| time at sea | 3502 hours |
| 2018 average statistics per journey | |
|---|---|
| average persons transported 🙎♀️ | 324 persons ⚙️ |
| average freight transported 🚛 | 863 metric tons ⚙️ |
| average speed | 23 km/h ⚙️ |
2018 monitoring methods:
N/A
2018 Theoretical
N/A
﹖ details
ℹ️
Figures with the icon ⚙️ were computed based on the published data.
You can find computation details on
this page ↗
GreenFerries is a hobby project, all the data shown here has no official value. It is Open Source, so you can double check and modify it.

The Ecoscore compares
average CO₂ emissions per passenger per km.
‟emits like 2.1 planes” means that the ferry emits more than twice what an average plane would on the same distance for one passenger.