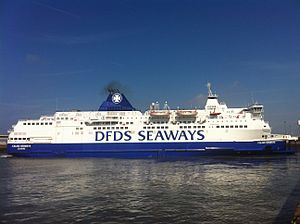
Calais Seaways

better than riding a car with two passengers
(based on 2022 data)
Often travels on 1 routes
- Dover [GB] ↔ Calais [FR] - 42 km
⚠️
Do you know of a route that this ship frequently travels but is not listed? Or have you noticed an error?
Please help by letting us know, thank you 🙇🏽♀️
Please help by letting us know, thank you 🙇🏽♀️
Ship Statistics
| 2022 yearly CO₂ Emissions | |||
|---|---|---|---|
| assigned to | total | average | ratio |
| persons 🙎♀️ | 492 tonnes CO₂ | 45 g·CO₂/pax/n.mile | 1 % ⚙️ |
| freight 🚛 | 44603 tonnes CO₂ | 561 kg·CO₂/m tonne/n.mile | 99 % ⚙️ |
| total | 45094 tonnes CO₂ | 602 kg·CO₂/n.mile | 100% |
| 2022 yearly statistics | |
|---|---|
| distance travelled | 138737 km ⚙️ |
| time at sea | 5273 hours |
| 2022 average statistics per journey | |
|---|---|
| average persons transported 🙎♀️ | 144 persons ⚙️ |
| average freight transported 🚛 | 1062 metric tons ⚙️ |
| average speed | 26 km/h ⚙️ |
2022 monitoring methods:
N/A
2022 Theoretical
EIV (Efficiency Indicator Values): 31.17 gCO₂/ton/nautical mile
﹖ details
| 2021 yearly CO₂ Emissions | |||
|---|---|---|---|
| assigned to | total | average | ratio |
| persons 🙎♀️ | 216 tonnes CO₂ | 32 g·CO₂/pax/n.mile | 1 % ⚙️ |
| freight 🚛 | 19622 tonnes CO₂ | 377 kg·CO₂/m tonne/n.mile | 99 % ⚙️ |
| total | 19838 tonnes CO₂ | 427 kg·CO₂/n.mile | 100% |
| 2021 yearly statistics | |
|---|---|
| distance travelled | 86052 km ⚙️ |
| time at sea | 3319 hours |
| 2021 average statistics per journey | |
|---|---|
| average persons transported 🙎♀️ | 148 persons ⚙️ |
| average freight transported 🚛 | 1120 metric tons ⚙️ |
| average speed | 26 km/h ⚙️ |
2021 monitoring methods:
N/A
2021 Theoretical
EIV (Efficiency Indicator Values): 31.17 gCO₂/ton/nautical mile
﹖ details
| 2020 yearly CO₂ Emissions | |||
|---|---|---|---|
| assigned to | total | average | ratio |
| persons 🙎♀️ | 14737 tonnes CO₂ | 3222 g·CO₂/pax/n.mile | 51 % ⚙️ |
| freight 🚛 | 14159 tonnes CO₂ | 215 kg·CO₂/m tonne/n.mile | 49 % ⚙️ |
| total | 28897 tonnes CO₂ | 651 kg·CO₂/n.mile | 100% |
| 2020 yearly statistics | |
|---|---|
| distance travelled | 82168 km ⚙️ |
| time at sea | 3218 hours |
| 2020 average statistics per journey | |
|---|---|
| average persons transported 🙎♀️ | 103 persons ⚙️ |
| average freight transported 🚛 | 1482 metric tons ⚙️ |
| average speed | 26 km/h ⚙️ |
2020 monitoring methods:
N/A
2020 Theoretical
EIV (Efficiency Indicator Values): 3.84 gCO₂/ton/nautical mile
﹖ details
| 2019 yearly CO₂ Emissions | |||
|---|---|---|---|
| assigned to | total | average | ratio |
| persons 🙎♀️ | 22517 tonnes CO₂ | 1545 g·CO₂/pax/n.mile | 51 % ⚙️ |
| freight 🚛 | 21634 tonnes CO₂ | 215 kg·CO₂/m tonne/n.mile | 49 % ⚙️ |
| total | 44150 tonnes CO₂ | 590 kg·CO₂/n.mile | 100% |
| 2019 yearly statistics | |
|---|---|
| distance travelled | 138645 km ⚙️ |
| time at sea | 5341 hours |
| 2019 average statistics per journey | |
|---|---|
| average persons transported 🙎♀️ | 195 persons ⚙️ |
| average freight transported 🚛 | 1347 metric tons ⚙️ |
| average speed | 26 km/h ⚙️ |
2019 monitoring methods:
N/A
2019 Theoretical
EIV (Efficiency Indicator Values): 3.84 gCO₂/ton/nautical mile
﹖ details
| 2018 yearly CO₂ Emissions | |||
|---|---|---|---|
| assigned to | total | average | ratio |
| persons 🙎♀️ | 42426 tonnes CO₂ | 2837 g·CO₂/pax/n.mile | 100 % ⚙️ |
| freight 🚛 | 42426 tonnes CO₂ | N/A | N/A |
| total | 42426 tonnes CO₂ | 573 kg·CO₂/n.mile | 100% |
| 2018 yearly statistics | |
|---|---|
| distance travelled | 137097 km ⚙️ |
| time at sea | 5274 hours |
| 2018 average statistics per journey | |
|---|---|
| average persons transported 🙎♀️ | 202 persons ⚙️ |
| average freight transported 🚛 | N/A |
| average speed | 26 km/h ⚙️ |
2018 monitoring methods:
N/A
2018 Theoretical
EIV (Efficiency Indicator Values): 3.84 gCO₂/ton/nautical mile
﹖ details
ℹ️
Figures with the icon ⚙️ were computed based on the published data.
You can find computation details on
this page ↗
GreenFerries is a hobby project, all the data shown here has no official value. It is Open Source, so you can double check and modify it.

The Ecoscore compares
average CO₂ emissions per passenger per km.
‟emits like 2.1 planes” means that the ferry emits more than twice what an average plane would on the same distance for one passenger.