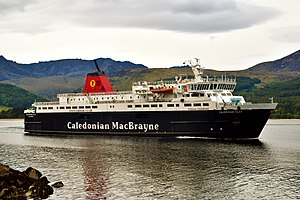
Caledonian Isles

better than riding a car with two passengers
(based on 2020 data)
Often travels on 1 routes
- Ardrossan [GB] ↔ Brodick [GB] - 22 km
⚠️
Do you know of a route that this ship frequently travels but is not listed? Or have you noticed an error?
Please help by letting us know, thank you 🙇🏽♀️
Please help by letting us know, thank you 🙇🏽♀️
Ship Statistics
| 2022 yearly CO₂ Emissions | |||
|---|---|---|---|
| assigned to | total | average | ratio |
| persons 🙎♀️ | N/A | N/A | N/A |
| freight 🚛 | N/A | N/A | N/A |
| total | N/A | N/A | 100% |
| 2022 yearly statistics | |
|---|---|
| distance travelled | N/A |
| time at sea | N/A |
| 2022 average statistics per journey | |
|---|---|
| average persons transported 🙎♀️ | N/A |
| average freight transported 🚛 | N/A |
| average speed | N/A |
2022 monitoring methods:
N/A
2022 Theoretical
N/A
﹖ details
| 2021 yearly CO₂ Emissions | |||
|---|---|---|---|
| assigned to | total | average | ratio |
| persons 🙎♀️ | N/A | N/A | N/A |
| freight 🚛 | N/A | N/A | N/A |
| total | N/A | N/A | 100% |
| 2021 yearly statistics | |
|---|---|
| distance travelled | N/A |
| time at sea | N/A |
| 2021 average statistics per journey | |
|---|---|
| average persons transported 🙎♀️ | N/A |
| average freight transported 🚛 | N/A |
| average speed | N/A |
2021 monitoring methods:
N/A
2021 Theoretical
N/A
﹖ details
| 2020 yearly CO₂ Emissions | |||
|---|---|---|---|
| assigned to | total | average | ratio |
| persons 🙎♀️ | 3579 tonnes CO₂ | 0.48 g·CO₂/pax/n.mile | 61 % ⚙️ |
| freight 🚛 | 2318 tonnes CO₂ | 0.31 kg·CO₂/m tonne/n.mile | 39 % ⚙️ |
| total | 5897 tonnes CO₂ | 212 kg·CO₂/n.mile | 100% |
| 2020 yearly statistics | |
|---|---|
| distance travelled | 51628 km ⚙️ |
| time at sea | 2288 hours |
| 2020 average statistics per journey | |
|---|---|
| average persons transported 🙎♀️ | 267466 persons ⚙️ |
| average freight transported 🚛 | 268247 metric tons ⚙️ |
| average speed | 23 km/h ⚙️ |
2020 monitoring methods:
N/A
2020 Theoretical
EIV (Efficiency Indicator Values): 68.56 gCO₂/ton/nautical mile
﹖ details
| 2019 yearly CO₂ Emissions | |||
|---|---|---|---|
| assigned to | total | average | ratio |
| persons 🙎♀️ | 4976 tonnes CO₂ | 0.45 g·CO₂/pax/n.mile | 64 % ⚙️ |
| freight 🚛 | 2124 tonnes CO₂ | 0.45 kg·CO₂/m tonne/n.mile | 36 % ⚙️ |
| total | 7722 tonnes CO₂ | 214 kg·CO₂/n.mile | 100% |
| 2019 yearly statistics | |
|---|---|
| distance travelled | 66759 km ⚙️ |
| time at sea | 2953 hours |
| 2019 average statistics per journey | |
|---|---|
| average persons transported 🙎♀️ | 306741 persons ⚙️ |
| average freight transported 🚛 | 130939 metric tons ⚙️ |
| average speed | 23 km/h ⚙️ |
2019 monitoring methods:
N/A
2019 Theoretical
N/A
﹖ details
| 2018 yearly CO₂ Emissions | |||
|---|---|---|---|
| assigned to | total | average | ratio |
| persons 🙎♀️ | 5021 tonnes CO₂ | 0.4 g·CO₂/pax/n.mile | 62 % ⚙️ |
| freight 🚛 | 2413 tonnes CO₂ | 0.4 kg·CO₂/m tonne/n.mile | 38 % ⚙️ |
| total | 8058 tonnes CO₂ | 206 kg·CO₂/n.mile | 100% |
| 2018 yearly statistics | |
|---|---|
| distance travelled | 72487 km ⚙️ |
| time at sea | 3216 hours |
| 2018 average statistics per journey | |
|---|---|
| average persons transported 🙎♀️ | 320725 persons ⚙️ |
| average freight transported 🚛 | 154129 metric tons ⚙️ |
| average speed | 23 km/h ⚙️ |
2018 monitoring methods:
N/A
2018 Theoretical
N/A
﹖ details
ℹ️
Figures with the icon ⚙️ were computed based on the published data.
You can find computation details on
this page ↗
GreenFerries is a hobby project, all the data shown here has no official value. It is Open Source, so you can double check and modify it.

The Ecoscore compares
average CO₂ emissions per passenger per km.
‟emits like 2.1 planes” means that the ferry emits more than twice what an average plane would on the same distance for one passenger.