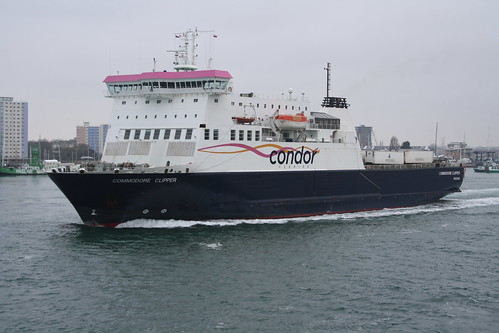
Commodore Clipper

over 4 times an average plane's emissions
(based on 2022 data)
Often travels on 1 routes
- Guernesey [GG] ↔ Portsmouth [GB] - 182 km
⚠️
Do you know of a route that this ship frequently travels but is not listed? Or have you noticed an error?
Please help by letting us know, thank you 🙇🏽♀️
Please help by letting us know, thank you 🙇🏽♀️
Ship Statistics
| 2022 yearly CO₂ Emissions | |||
|---|---|---|---|
| assigned to | total | average | ratio |
| persons 🙎♀️ | 29 tonnes CO₂ | 3422 g·CO₂/pax/n.mile | 17 % ⚙️ |
| freight 🚛 | 141 tonnes CO₂ | 185 kg·CO₂/m tonne/n.mile | 83 % ⚙️ |
| total | 170 tonnes CO₂ | 224 kg·CO₂/n.mile | 100% |
| 2022 yearly statistics | |
|---|---|
| distance travelled | 1410 km ⚙️ |
| time at sea | 119 hours |
| 2022 average statistics per journey | |
|---|---|
| average persons transported 🙎♀️ | 11 persons ⚙️ |
| average freight transported 🚛 | 1003 metric tons ⚙️ |
| average speed | 12 km/h ⚙️ |
2022 monitoring methods:
N/A
2022 Theoretical
EIV (Efficiency Indicator Values): 30.13 gCO₂/ton/nautical mile
﹖ details
| 2021 yearly CO₂ Emissions | |||
|---|---|---|---|
| assigned to | total | average | ratio |
| persons 🙎♀️ | 57 tonnes CO₂ | 991 g·CO₂/pax/n.mile | 17 % ⚙️ |
| freight 🚛 | 280 tonnes CO₂ | 333 kg·CO₂/m tonne/n.mile | 83 % ⚙️ |
| total | 338 tonnes CO₂ | 258 kg·CO₂/n.mile | 100% |
| 2021 yearly statistics | |
|---|---|
| distance travelled | 2421 km ⚙️ |
| time at sea | 146 hours |
| 2021 average statistics per journey | |
|---|---|
| average persons transported 🙎♀️ | 44 persons ⚙️ |
| average freight transported 🚛 | 643 metric tons ⚙️ |
| average speed | 17 km/h ⚙️ |
2021 monitoring methods:
N/A
2021 Theoretical
EIV (Efficiency Indicator Values): 30.13 gCO₂/ton/nautical mile
﹖ details
| 2020 yearly CO₂ Emissions | |||
|---|---|---|---|
| assigned to | total | average | ratio |
| persons 🙎♀️ | 2676 tonnes CO₂ | 1705 g·CO₂/pax/n.mile | 17 % ⚙️ |
| freight 🚛 | 13067 tonnes CO₂ | 245 kg·CO₂/m tonne/n.mile | 83 % ⚙️ |
| total | 15743 tonnes CO₂ | 259 kg·CO₂/n.mile | 100% |
| 2020 yearly statistics | |
|---|---|
| distance travelled | 112784 km ⚙️ |
| time at sea | 4300 hours |
| 2020 average statistics per journey | |
|---|---|
| average persons transported 🙎♀️ | 26 persons ⚙️ |
| average freight transported 🚛 | 874 metric tons ⚙️ |
| average speed | 26 km/h ⚙️ |
2020 monitoring methods:
N/A
2020 Theoretical
EIV (Efficiency Indicator Values): 30.13 gCO₂/ton/nautical mile
﹖ details
| 2019 yearly CO₂ Emissions | |||
|---|---|---|---|
| assigned to | total | average | ratio |
| persons 🙎♀️ | 3390 tonnes CO₂ | 641 g·CO₂/pax/n.mile | 17 % ⚙️ |
| freight 🚛 | 16551 tonnes CO₂ | 265 kg·CO₂/m tonne/n.mile | 83 % ⚙️ |
| total | 19941 tonnes CO₂ | 290 kg·CO₂/n.mile | 100% |
| 2019 yearly statistics | |
|---|---|
| distance travelled | 127191 km ⚙️ |
| time at sea | 4909 hours |
| 2019 average statistics per journey | |
|---|---|
| average persons transported 🙎♀️ | 77 persons ⚙️ |
| average freight transported 🚛 | 910 metric tons ⚙️ |
| average speed | 26 km/h ⚙️ |
2019 monitoring methods:
N/A
2019 Theoretical
EIV (Efficiency Indicator Values): 30.13 gCO₂/ton/nautical mile
﹖ details
| 2018 yearly CO₂ Emissions | |||
|---|---|---|---|
| assigned to | total | average | ratio |
| persons 🙎♀️ | 2890 tonnes CO₂ | 424 g·CO₂/pax/n.mile | 17 % ⚙️ |
| freight 🚛 | 14112 tonnes CO₂ | 236 kg·CO₂/m tonne/n.mile | 83 % ⚙️ |
| total | 17002 tonnes CO₂ | 230 kg·CO₂/n.mile | 100% |
| 2018 yearly statistics | |
|---|---|
| distance travelled | 137130 km ⚙️ |
| time at sea | 5108 hours |
| 2018 average statistics per journey | |
|---|---|
| average persons transported 🙎♀️ | 92 persons ⚙️ |
| average freight transported 🚛 | 809 metric tons ⚙️ |
| average speed | 27 km/h ⚙️ |
2018 monitoring methods:
N/A
2018 Theoretical
N/A
﹖ details
ℹ️
Figures with the icon ⚙️ were computed based on the published data.
You can find computation details on
this page ↗
GreenFerries is a hobby project, all the data shown here has no official value. It is Open Source, so you can double check and modify it.

The Ecoscore compares
average CO₂ emissions per passenger per km.
‟emits like 2.1 planes” means that the ferry emits more than twice what an average plane would on the same distance for one passenger.