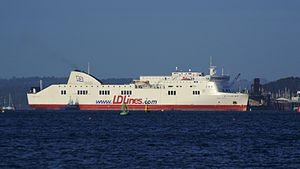
Connemara

over 4 times an average plane's emissions
(based on 2022 data)
Often travels on 2 routes
- Roscoff [FR] ↔ Ringaskiddy [IE] - 463 km
- Santander [ES] ↔ Ringaskiddy [IE] - 990 km
⚠️
Do you know of a route that this ship frequently travels but is not listed? Or have you noticed an error?
Please help by letting us know, thank you 🙇🏽♀️
Please help by letting us know, thank you 🙇🏽♀️
Ship Statistics
| 2022 yearly CO₂ Emissions | |||
|---|---|---|---|
| assigned to | total | average | ratio |
| persons 🙎♀️ | 28714 tonnes CO₂ | 1302 g·CO₂/pax/n.mile | 44 % ⚙️ |
| freight 🚛 | 36545 tonnes CO₂ | 159 kg·CO₂/m tonne/n.mile | 56 % ⚙️ |
| total | 65259 tonnes CO₂ | 543 kg·CO₂/n.mile | 100% |
| 2022 yearly statistics | |
|---|---|
| distance travelled | 222775 km ⚙️ |
| time at sea | 6168 hours |
| 2022 average statistics per journey | |
|---|---|
| average persons transported 🙎♀️ | 183 persons ⚙️ |
| average freight transported 🚛 | 1915 metric tons ⚙️ |
| average speed | 36 km/h ⚙️ |
2022 monitoring methods:
N/A
2022 Theoretical
EIV (Efficiency Indicator Values): 19.32 gCO₂/ton/nautical mile
﹖ details
| 2021 yearly CO₂ Emissions | |||
|---|---|---|---|
| assigned to | total | average | ratio |
| persons 🙎♀️ | 33567 tonnes CO₂ | 2155 g·CO₂/pax/n.mile | 50 % ⚙️ |
| freight 🚛 | 33567 tonnes CO₂ | 153 kg·CO₂/m tonne/n.mile | 50 % ⚙️ |
| total | 67134 tonnes CO₂ | 505 kg·CO₂/n.mile | 100% |
| 2021 yearly statistics | |
|---|---|
| distance travelled | 246411 km ⚙️ |
| time at sea | 6872 hours |
| 2021 average statistics per journey | |
|---|---|
| average persons transported 🙎♀️ | 117 persons ⚙️ |
| average freight transported 🚛 | 1649 metric tons ⚙️ |
| average speed | 36 km/h ⚙️ |
2021 monitoring methods:
N/A
2021 Theoretical
EIV (Efficiency Indicator Values): 19.32 gCO₂/ton/nautical mile
﹖ details
| 2020 yearly CO₂ Emissions | |||
|---|---|---|---|
| assigned to | total | average | ratio |
| persons 🙎♀️ | 13568 tonnes CO₂ | 4021 g·CO₂/pax/n.mile | 50 % ⚙️ |
| freight 🚛 | 13568 tonnes CO₂ | 673 kg·CO₂/m tonne/n.mile | 50 % ⚙️ |
| total | 27137 tonnes CO₂ | 550 kg·CO₂/n.mile | 100% |
| 2020 yearly statistics | |
|---|---|
| distance travelled | 91305 km ⚙️ |
| time at sea | 3560 hours |
| 2020 average statistics per journey | |
|---|---|
| average persons transported 🙎♀️ | 68 persons ⚙️ |
| average freight transported 🚛 | 409 metric tons ⚙️ |
| average speed | 26 km/h ⚙️ |
2020 monitoring methods:
N/A
2020 Theoretical
EIV (Efficiency Indicator Values): 19.32 gCO₂/ton/nautical mile
﹖ details
| 2019 yearly CO₂ Emissions | |||
|---|---|---|---|
| assigned to | total | average | ratio |
| persons 🙎♀️ | 10785 tonnes CO₂ | 543 g·CO₂/pax/n.mile | 17 % ⚙️ |
| freight 🚛 | 52067 tonnes CO₂ | 621 kg·CO₂/m tonne/n.mile | 83 % ⚙️ |
| total | 62852 tonnes CO₂ | 577 kg·CO₂/n.mile | 100% |
| 2019 yearly statistics | |
|---|---|
| distance travelled | 201593 km ⚙️ |
| time at sea | 5815 hours |
| 2019 average statistics per journey | |
|---|---|
| average persons transported 🙎♀️ | 182 persons ⚙️ |
| average freight transported 🚛 | 770 metric tons ⚙️ |
| average speed | 35 km/h ⚙️ |
2019 monitoring methods:
N/A
2019 Theoretical
EIV (Efficiency Indicator Values): 19.62 gCO₂/ton/nautical mile
﹖ details
| 2018 yearly CO₂ Emissions | |||
|---|---|---|---|
| assigned to | total | average | ratio |
| persons 🙎♀️ | 42350 tonnes CO₂ | 2907 g·CO₂/pax/n.mile | 100 % ⚙️ |
| freight 🚛 | 42350 tonnes CO₂ | 281 kg·CO₂/m tonne/n.mile | -0.00002361280664331389 % ⚙️ |
| total | 42350 tonnes CO₂ | 505 kg·CO₂/n.mile | 100% |
| 2018 yearly statistics | |
|---|---|
| distance travelled | 155176 km ⚙️ |
| time at sea | 4317 hours |
| 2018 average statistics per journey | |
|---|---|
| average persons transported 🙎♀️ | 174 persons ⚙️ |
| average freight transported 🚛 | 1798 metric tons ⚙️ |
| average speed | 36 km/h ⚙️ |
2018 monitoring methods:
N/A
2018 Theoretical
N/A
﹖ details
ℹ️
Figures with the icon ⚙️ were computed based on the published data.
You can find computation details on
this page ↗
GreenFerries is a hobby project, all the data shown here has no official value. It is Open Source, so you can double check and modify it.

The Ecoscore compares
average CO₂ emissions per passenger per km.
‟emits like 2.1 planes” means that the ferry emits more than twice what an average plane would on the same distance for one passenger.