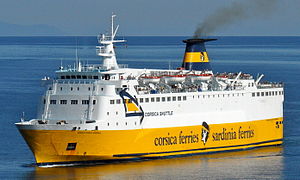
Corsica Marina Seconda

(based on 2022 data)
Often travels on 1 routes
- Livorno [IT] ↔ Bastia [FR] - 117 km
⚠️
Do you know of a route that this ship frequently travels but is not listed? Or have you noticed an error?
Please help by letting us know, thank you 🙇🏽♀️
Please help by letting us know, thank you 🙇🏽♀️
Ship Statistics
| 2022 yearly CO₂ Emissions | |||
|---|---|---|---|
| assigned to | total | average | ratio |
| persons 🙎♀️ | N/A | N/A | N/A |
| freight 🚛 | 572 tonnes CO₂ | 490 kg·CO₂/m tonne/n.mile | 100 % ⚙️ |
| total | 1112 tonnes CO₂ | 300 kg·CO₂/n.mile | 100% |
| 2022 yearly statistics | |
|---|---|
| distance travelled | 6875 km ⚙️ |
| time at sea | 351 hours |
| 2022 average statistics per journey | |
|---|---|
| average persons transported 🙎♀️ | N/A |
| average freight transported 🚛 | 314 metric tons ⚙️ |
| average speed | 20 km/h ⚙️ |
2022 monitoring methods:
N/A
2022 Theoretical
EIV (Efficiency Indicator Values): 11.49 gCO₂/ton/nautical mile
﹖ details
| 2021 yearly CO₂ Emissions | |||
|---|---|---|---|
| assigned to | total | average | ratio |
| persons 🙎♀️ | 1189 tonnes CO₂ | 137 g·CO₂/pax/n.mile | 11 % ⚙️ |
| freight 🚛 | 6750 tonnes CO₂ | 554 kg·CO₂/m tonne/n.mile | 89 % ⚙️ |
| total | 10986 tonnes CO₂ | 334 kg·CO₂/n.mile | 100% |
| 2021 yearly statistics | |
|---|---|
| distance travelled | 60951 km ⚙️ |
| time at sea | 2289 hours |
| 2021 average statistics per journey | |
|---|---|
| average persons transported 🙎♀️ | 264 persons ⚙️ |
| average freight transported 🚛 | 370 metric tons ⚙️ |
| average speed | 27 km/h ⚙️ |
2021 monitoring methods:
N/A
2021 Theoretical
EIV (Efficiency Indicator Values): 11.49 gCO₂/ton/nautical mile
﹖ details
| 2020 yearly CO₂ Emissions | |||
|---|---|---|---|
| assigned to | total | average | ratio |
| persons 🙎♀️ | 430 tonnes CO₂ | 78 g·CO₂/pax/n.mile | 5 % ⚙️ |
| freight 🚛 | 6732 tonnes CO₂ | 860 kg·CO₂/m tonne/n.mile | 95 % ⚙️ |
| total | 7905 tonnes CO₂ | 339 kg·CO₂/n.mile | 100% |
| 2020 yearly statistics | |
|---|---|
| distance travelled | 43250 km ⚙️ |
| time at sea | 2114 hours |
| 2020 average statistics per journey | |
|---|---|
| average persons transported 🙎♀️ | 237 persons ⚙️ |
| average freight transported 🚛 | 335 metric tons ⚙️ |
| average speed | 20 km/h ⚙️ |
2020 monitoring methods:
N/A
2020 Theoretical
EIV (Efficiency Indicator Values): 11.49 gCO₂/ton/nautical mile
﹖ details
| 2019 yearly CO₂ Emissions | |||
|---|---|---|---|
| assigned to | total | average | ratio |
| persons 🙎♀️ | 406 tonnes CO₂ | 79 g·CO₂/pax/n.mile | 14 % ⚙️ |
| freight 🚛 | 2493 tonnes CO₂ | 797 kg·CO₂/m tonne/n.mile | 86 % ⚙️ |
| total | 2898 tonnes CO₂ | 345 kg·CO₂/n.mile | 100% |
| 2019 yearly statistics | |
|---|---|
| distance travelled | 15579 km ⚙️ |
| time at sea | 549 hours |
| 2019 average statistics per journey | |
|---|---|
| average persons transported 🙎♀️ | 611 persons ⚙️ |
| average freight transported 🚛 | 372 metric tons ⚙️ |
| average speed | 28 km/h ⚙️ |
2019 monitoring methods:
N/A
2019 Theoretical
EIV (Efficiency Indicator Values): 11.49 gCO₂/ton/nautical mile
﹖ details
| 2018 yearly CO₂ Emissions | |||
|---|---|---|---|
| assigned to | total | average | ratio |
| persons 🙎♀️ | 935 tonnes CO₂ | 101 g·CO₂/pax/n.mile | 13 % ⚙️ |
| freight 🚛 | 6257 tonnes CO₂ | 1037 kg·CO₂/m tonne/n.mile | 87 % ⚙️ |
| total | 7192 tonnes CO₂ | 351 kg·CO₂/n.mile | 100% |
| 2018 yearly statistics | |
|---|---|
| distance travelled | 37973 km ⚙️ |
| time at sea | 1508 hours |
| 2018 average statistics per journey | |
|---|---|
| average persons transported 🙎♀️ | 451 persons ⚙️ |
| average freight transported 🚛 | 294 metric tons ⚙️ |
| average speed | 25 km/h ⚙️ |
2018 monitoring methods:
N/A
2018 Theoretical
EIV (Efficiency Indicator Values): 11.49 gCO₂/ton/nautical mile
﹖ details
ℹ️
Figures with the icon ⚙️ were computed based on the published data.
You can find computation details on
this page ↗
GreenFerries is a hobby project, all the data shown here has no official value. It is Open Source, so you can double check and modify it.

The Ecoscore compares
average CO₂ emissions per passenger per km.
‟emits like 2.1 planes” means that the ferry emits more than twice what an average plane would on the same distance for one passenger.