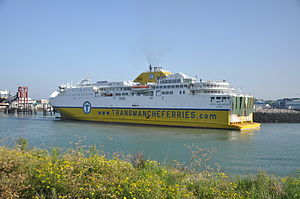
Côte d'Albâtre

2 to 4 times an average plane's emissions
(based on 2022 data)
Often travels on 1 routes
- Newhaven [GB] ↔ Dieppe [FR] - 121 km
⚠️
Do you know of a route that this ship frequently travels but is not listed? Or have you noticed an error?
Please help by letting us know, thank you 🙇🏽♀️
Please help by letting us know, thank you 🙇🏽♀️
Ship Statistics
| 2022 yearly CO₂ Emissions | |||
|---|---|---|---|
| assigned to | total | average | ratio |
| persons 🙎♀️ | 11568 tonnes CO₂ | 898 g·CO₂/pax/n.mile | 49 % ⚙️ |
| freight 🚛 | 12040 tonnes CO₂ | 316 kg·CO₂/m tonne/n.mile | 51 % ⚙️ |
| total | 23608 tonnes CO₂ | 394 kg·CO₂/n.mile | 100% |
| 2022 yearly statistics | |
|---|---|
| distance travelled | 110857 km ⚙️ |
| time at sea | 3862 hours |
| 2022 average statistics per journey | |
|---|---|
| average persons transported 🙎♀️ | 215 persons ⚙️ |
| average freight transported 🚛 | 636 metric tons ⚙️ |
| average speed | 29 km/h ⚙️ |
2022 monitoring methods:
N/A
2022 Theoretical
EIV (Efficiency Indicator Values): 40.99 gCO₂/ton/nautical mile
﹖ details
| 2021 yearly CO₂ Emissions | |||
|---|---|---|---|
| assigned to | total | average | ratio |
| persons 🙎♀️ | 12462 tonnes CO₂ | 3090 g·CO₂/pax/n.mile | 49 % ⚙️ |
| freight 🚛 | 12971 tonnes CO₂ | 379 kg·CO₂/m tonne/n.mile | 51 % ⚙️ |
| total | 25433 tonnes CO₂ | 346 kg·CO₂/n.mile | 100% |
| 2021 yearly statistics | |
|---|---|
| distance travelled | 136115 km ⚙️ |
| time at sea | 4894 hours |
| 2021 average statistics per journey | |
|---|---|
| average persons transported 🙎♀️ | 55 persons ⚙️ |
| average freight transported 🚛 | 466 metric tons ⚙️ |
| average speed | 28 km/h ⚙️ |
2021 monitoring methods:
N/A
2021 Theoretical
EIV (Efficiency Indicator Values): 7.15 gCO₂/ton/nautical mile
﹖ details
| 2020 yearly CO₂ Emissions | |||
|---|---|---|---|
| assigned to | total | average | ratio |
| persons 🙎♀️ | 8691 tonnes CO₂ | 1789 g·CO₂/pax/n.mile | 49 % ⚙️ |
| freight 🚛 | 9046 tonnes CO₂ | 251 kg·CO₂/m tonne/n.mile | 51 % ⚙️ |
| total | 17738 tonnes CO₂ | 382 kg·CO₂/n.mile | 100% |
| 2020 yearly statistics | |
|---|---|
| distance travelled | 86049 km ⚙️ |
| time at sea | 2982 hours |
| 2020 average statistics per journey | |
|---|---|
| average persons transported 🙎♀️ | 105 persons ⚙️ |
| average freight transported 🚛 | 777 metric tons ⚙️ |
| average speed | 29 km/h ⚙️ |
2020 monitoring methods:
N/A
2020 Theoretical
EIV (Efficiency Indicator Values): 7.15 gCO₂/ton/nautical mile
﹖ details
| 2019 yearly CO₂ Emissions | |||
|---|---|---|---|
| assigned to | total | average | ratio |
| persons 🙎♀️ | 10929 tonnes CO₂ | 953 g·CO₂/pax/n.mile | 49 % ⚙️ |
| freight 🚛 | 11375 tonnes CO₂ | 303 kg·CO₂/m tonne/n.mile | 51 % ⚙️ |
| total | 22304 tonnes CO₂ | 393 kg·CO₂/n.mile | 100% |
| 2019 yearly statistics | |
|---|---|
| distance travelled | 104997 km ⚙️ |
| time at sea | 5190 hours |
| 2019 average statistics per journey | |
|---|---|
| average persons transported 🙎♀️ | 202 persons ⚙️ |
| average freight transported 🚛 | 663 metric tons ⚙️ |
| average speed | 20 km/h ⚙️ |
2019 monitoring methods:
N/A
2019 Theoretical
EIV (Efficiency Indicator Values): 7.15 gCO₂/ton/nautical mile
﹖ details
| 2018 yearly CO₂ Emissions | |||
|---|---|---|---|
| assigned to | total | average | ratio |
| persons 🙎♀️ | 21466 tonnes CO₂ | 1766 g·CO₂/pax/n.mile | 100 % ⚙️ |
| freight 🚛 | 21466 tonnes CO₂ | N/A | N/A |
| total | 21466 tonnes CO₂ | 387 kg·CO₂/n.mile | 100% |
| 2018 yearly statistics | |
|---|---|
| distance travelled | 102675 km ⚙️ |
| time at sea | 3654 hours |
| 2018 average statistics per journey | |
|---|---|
| average persons transported 🙎♀️ | 219 persons ⚙️ |
| average freight transported 🚛 | N/A |
| average speed | 28 km/h ⚙️ |
2018 monitoring methods:
N/A
2018 Theoretical
EIV (Efficiency Indicator Values): 7.15 gCO₂/ton/nautical mile
﹖ details
ℹ️
Figures with the icon ⚙️ were computed based on the published data.
You can find computation details on
this page ↗
GreenFerries is a hobby project, all the data shown here has no official value. It is Open Source, so you can double check and modify it.

The Ecoscore compares
average CO₂ emissions per passenger per km.
‟emits like 2.1 planes” means that the ferry emits more than twice what an average plane would on the same distance for one passenger.