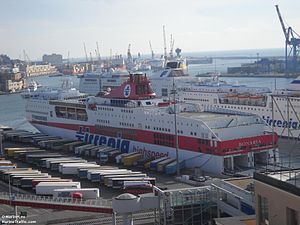
Cruise Bonaria

2 to 4 times an average plane's emissions
(based on 2022 data)
Often travels on 3 routes
- Civitavecchia [IT] ↔ Cagliari [IT] - 390 km
- Civitavecchia [IT] ↔ Olbia [IT] - 231 km
- Gênes [IT] ↔ Porto Torres [IT] - 399 km
⚠️
Do you know of a route that this ship frequently travels but is not listed? Or have you noticed an error?
Please help by letting us know, thank you 🙇🏽♀️
Please help by letting us know, thank you 🙇🏽♀️
Ship Statistics
| 2022 yearly CO₂ Emissions | |||
|---|---|---|---|
| assigned to | total | average | ratio |
| persons 🙎♀️ | 42230 tonnes CO₂ | 830 g·CO₂/pax/n.mile | 80 % ⚙️ |
| freight 🚛 | 10557 tonnes CO₂ | 48 kg·CO₂/m tonne/n.mile | 20 % ⚙️ |
| total | 52805 tonnes CO₂ | 774 kg·CO₂/n.mile | 100% |
| 2022 yearly statistics | |
|---|---|
| distance travelled | 126346 km ⚙️ |
| time at sea | 3400 hours |
| 2022 average statistics per journey | |
|---|---|
| average persons transported 🙎♀️ | 746 persons ⚙️ |
| average freight transported 🚛 | 3258 metric tons ⚙️ |
| average speed | 37 km/h ⚙️ |
2022 monitoring methods:
N/A
2022 Theoretical
EIV (Efficiency Indicator Values): 21.49 gCO₂/ton/nautical mile
﹖ details
| 2021 yearly CO₂ Emissions | |||
|---|---|---|---|
| assigned to | total | average | ratio |
| persons 🙎♀️ | 46716 tonnes CO₂ | 1180 g·CO₂/pax/n.mile | 80 % ⚙️ |
| freight 🚛 | 11679 tonnes CO₂ | 46 kg·CO₂/m tonne/n.mile | 20 % ⚙️ |
| total | 58395 tonnes CO₂ | 799 kg·CO₂/n.mile | 100% |
| 2021 yearly statistics | |
|---|---|
| distance travelled | 135298 km ⚙️ |
| time at sea | 3536 hours |
| 2021 average statistics per journey | |
|---|---|
| average persons transported 🙎♀️ | 542 persons ⚙️ |
| average freight transported 🚛 | 3496 metric tons ⚙️ |
| average speed | 38 km/h ⚙️ |
2021 monitoring methods:
N/A
2021 Theoretical
EIV (Efficiency Indicator Values): 21.49 gCO₂/ton/nautical mile
﹖ details
| 2020 yearly CO₂ Emissions | |||
|---|---|---|---|
| assigned to | total | average | ratio |
| persons 🙎♀️ | 48057 tonnes CO₂ | 2142 g·CO₂/pax/n.mile | 80 % ⚙️ |
| freight 🚛 | 12014 tonnes CO₂ | 102 kg·CO₂/m tonne/n.mile | 20 % ⚙️ |
| total | 60071 tonnes CO₂ | 734 kg·CO₂/n.mile | 100% |
| 2020 yearly statistics | |
|---|---|
| distance travelled | 151629 km ⚙️ |
| time at sea | 3971 hours |
| 2020 average statistics per journey | |
|---|---|
| average persons transported 🙎♀️ | 274 persons ⚙️ |
| average freight transported 🚛 | 1433 metric tons ⚙️ |
| average speed | 38 km/h ⚙️ |
2020 monitoring methods:
N/A
2020 Theoretical
EIV (Efficiency Indicator Values): 21.49 gCO₂/ton/nautical mile
﹖ details
| 2019 yearly CO₂ Emissions | |||
|---|---|---|---|
| assigned to | total | average | ratio |
| persons 🙎♀️ | 36357 tonnes CO₂ | 963 g·CO₂/pax/n.mile | 80 % ⚙️ |
| freight 🚛 | 9089 tonnes CO₂ | 69 kg·CO₂/m tonne/n.mile | 20 % ⚙️ |
| total | 45446 tonnes CO₂ | 718 kg·CO₂/n.mile | 100% |
| 2019 yearly statistics | |
|---|---|
| distance travelled | 117297 km ⚙️ |
| time at sea | 2940 hours |
| 2019 average statistics per journey | |
|---|---|
| average persons transported 🙎♀️ | 596 persons ⚙️ |
| average freight transported 🚛 | 2072 metric tons ⚙️ |
| average speed | 40 km/h ⚙️ |
2019 monitoring methods:
N/A
2019 Theoretical
EIV (Efficiency Indicator Values): 21.49 gCO₂/ton/nautical mile
﹖ details
| 2018 yearly CO₂ Emissions | |||
|---|---|---|---|
| assigned to | total | average | ratio |
| persons 🙎♀️ | 53990 tonnes CO₂ | 957 g·CO₂/pax/n.mile | 80 % ⚙️ |
| freight 🚛 | 13498 tonnes CO₂ | 62 kg·CO₂/m tonne/n.mile | 20 % ⚙️ |
| total | 67487 tonnes CO₂ | 722 kg·CO₂/n.mile | 100% |
| 2018 yearly statistics | |
|---|---|
| distance travelled | 173021 km ⚙️ |
| time at sea | 4366 hours |
| 2018 average statistics per journey | |
|---|---|
| average persons transported 🙎♀️ | 604 persons ⚙️ |
| average freight transported 🚛 | 2320 metric tons ⚙️ |
| average speed | 40 km/h ⚙️ |
2018 monitoring methods:
N/A
2018 Theoretical
EIV (Efficiency Indicator Values): 21.49 gCO₂/ton/nautical mile
﹖ details
ℹ️
Figures with the icon ⚙️ were computed based on the published data.
You can find computation details on
this page ↗
GreenFerries is a hobby project, all the data shown here has no official value. It is Open Source, so you can double check and modify it.

The Ecoscore compares
average CO₂ emissions per passenger per km.
‟emits like 2.1 planes” means that the ferry emits more than twice what an average plane would on the same distance for one passenger.