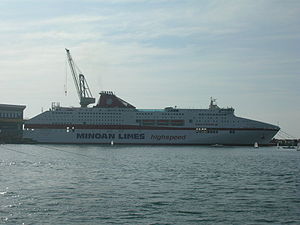
Cruise Olympia

2 to 4 times an average plane's emissions
(based on 2022 data)
Often travels on 2 routes
- Ancona [IT] ↔ Durres [AL] - 549 km
- Ancona [IT] ↔ Igoumenitsa [GR] - 723 km
⚠️
Do you know of a route that this ship frequently travels but is not listed? Or have you noticed an error?
Please help by letting us know, thank you 🙇🏽♀️
Please help by letting us know, thank you 🙇🏽♀️
Ship Statistics
| 2022 yearly CO₂ Emissions | |||
|---|---|---|---|
| assigned to | total | average | ratio |
| persons 🙎♀️ | 50295 tonnes CO₂ | 642 g·CO₂/pax/n.mile | 66 % ⚙️ |
| freight 🚛 | 25910 tonnes CO₂ | 101 kg·CO₂/m tonne/n.mile | 34 % ⚙️ |
| total | 76205 tonnes CO₂ | 725 kg·CO₂/n.mile | 100% |
| 2022 yearly statistics | |
|---|---|
| distance travelled | 194642 km ⚙️ |
| time at sea | 5512 hours |
| 2022 average statistics per journey | |
|---|---|
| average persons transported 🙎♀️ | 745 persons ⚙️ |
| average freight transported 🚛 | 2452 metric tons ⚙️ |
| average speed | 35 km/h ⚙️ |
2022 monitoring methods:
N/A
2022 Theoretical
EIV (Efficiency Indicator Values): 19.21 gCO₂/ton/nautical mile
﹖ details
| 2021 yearly CO₂ Emissions | |||
|---|---|---|---|
| assigned to | total | average | ratio |
| persons 🙎♀️ | 60934 tonnes CO₂ | 997 g·CO₂/pax/n.mile | 66 % ⚙️ |
| freight 🚛 | 31390 tonnes CO₂ | 118 kg·CO₂/m tonne/n.mile | 34 % ⚙️ |
| total | 92324 tonnes CO₂ | 868 kg·CO₂/n.mile | 100% |
| 2021 yearly statistics | |
|---|---|
| distance travelled | 197024 km ⚙️ |
| time at sea | 5236 hours |
| 2021 average statistics per journey | |
|---|---|
| average persons transported 🙎♀️ | 574 persons ⚙️ |
| average freight transported 🚛 | 2491 metric tons ⚙️ |
| average speed | 38 km/h ⚙️ |
2021 monitoring methods:
N/A
2021 Theoretical
EIV (Efficiency Indicator Values): 19.21 gCO₂/ton/nautical mile
﹖ details
| 2020 yearly CO₂ Emissions | |||
|---|---|---|---|
| assigned to | total | average | ratio |
| persons 🙎♀️ | 99753 tonnes CO₂ | 2919 g·CO₂/pax/n.mile | 66 % ⚙️ |
| freight 🚛 | 51388 tonnes CO₂ | 111 kg·CO₂/m tonne/n.mile | 34 % ⚙️ |
| total | 151141 tonnes CO₂ | 972 kg·CO₂/n.mile | 100% |
| 2020 yearly statistics | |
|---|---|
| distance travelled | 288024 km ⚙️ |
| time at sea | 6166 hours |
| 2020 average statistics per journey | |
|---|---|
| average persons transported 🙎♀️ | 220 persons ⚙️ |
| average freight transported 🚛 | 2975 metric tons ⚙️ |
| average speed | 47 km/h ⚙️ |
2020 monitoring methods:
N/A
2020 Theoretical
EIV (Efficiency Indicator Values): 19.21 gCO₂/ton/nautical mile
﹖ details
| 2019 yearly CO₂ Emissions | |||
|---|---|---|---|
| assigned to | total | average | ratio |
| persons 🙎♀️ | 70132 tonnes CO₂ | 1073 g·CO₂/pax/n.mile | 66 % ⚙️ |
| freight 🚛 | 36128 tonnes CO₂ | 99 kg·CO₂/m tonne/n.mile | 34 % ⚙️ |
| total | 106260 tonnes CO₂ | 1028 kg·CO₂/n.mile | 100% |
| 2019 yearly statistics | |
|---|---|
| distance travelled | 191494 km ⚙️ |
| time at sea | 4006 hours |
| 2019 average statistics per journey | |
|---|---|
| average persons transported 🙎♀️ | 632 persons ⚙️ |
| average freight transported 🚛 | 3517 metric tons ⚙️ |
| average speed | 48 km/h ⚙️ |
2019 monitoring methods:
N/A
2019 Theoretical
EIV (Efficiency Indicator Values): 19.21 gCO₂/ton/nautical mile
﹖ details
| 2018 yearly CO₂ Emissions | |||
|---|---|---|---|
| assigned to | total | average | ratio |
| persons 🙎♀️ | 103287 tonnes CO₂ | 937 g·CO₂/pax/n.mile | 66 % ⚙️ |
| freight 🚛 | 53208 tonnes CO₂ | 39 kg·CO₂/m tonne/n.mile | 34 % ⚙️ |
| total | 156495 tonnes CO₂ | 946 kg·CO₂/n.mile | 100% |
| 2018 yearly statistics | |
|---|---|
| distance travelled | 306273 km ⚙️ |
| time at sea | 7245 hours |
| 2018 average statistics per journey | |
|---|---|
| average persons transported 🙎♀️ | 666 persons ⚙️ |
| average freight transported 🚛 | 8235 metric tons ⚙️ |
| average speed | 42 km/h ⚙️ |
2018 monitoring methods:
N/A
2018 Theoretical
EIV (Efficiency Indicator Values): 19.21 gCO₂/ton/nautical mile
﹖ details
ℹ️
Figures with the icon ⚙️ were computed based on the published data.
You can find computation details on
this page ↗
GreenFerries is a hobby project, all the data shown here has no official value. It is Open Source, so you can double check and modify it.

The Ecoscore compares
average CO₂ emissions per passenger per km.
‟emits like 2.1 planes” means that the ferry emits more than twice what an average plane would on the same distance for one passenger.