Cruise Roma
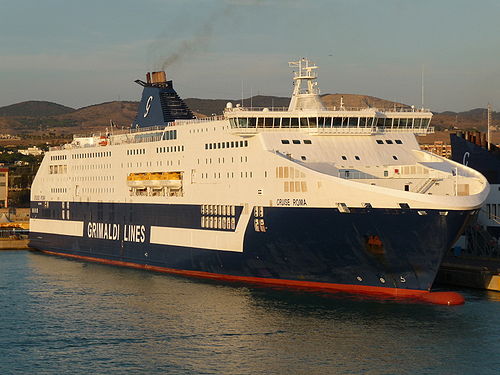

2 to 4 times an average plane's emissions
(based on 2022 data)
Often travels on 0 routes
⚠️
Do you know of a route that this ship frequently travels but is not listed? Or have you noticed an error?
Please help by letting us know, thank you 🙇🏽♀️
Please help by letting us know, thank you 🙇🏽♀️
Ship Statistics
| 2022 yearly CO₂ Emissions | |||
|---|---|---|---|
| assigned to | total | average | ratio |
| persons 🙎♀️ | 81793 tonnes CO₂ | 1045 g·CO₂/pax/n.mile | 68 % ⚙️ |
| freight 🚛 | 38491 tonnes CO₂ | 67 kg·CO₂/m tonne/n.mile | 32 % ⚙️ |
| total | 120285 tonnes CO₂ | 950 kg·CO₂/n.mile | 100% |
| 2022 yearly statistics | |
|---|---|
| distance travelled | 234507 km ⚙️ |
| time at sea | 5880 hours |
| 2022 average statistics per journey | |
|---|---|
| average persons transported 🙎♀️ | 618 persons ⚙️ |
| average freight transported 🚛 | 4543 metric tons ⚙️ |
| average speed | 40 km/h ⚙️ |
2022 monitoring methods:
N/A
2022 Theoretical
EIV (Efficiency Indicator Values): 19.21 gCO₂/ton/nautical mile
﹖ details
| 2021 yearly CO₂ Emissions | |||
|---|---|---|---|
| assigned to | total | average | ratio |
| persons 🙎♀️ | 103038 tonnes CO₂ | 2194 g·CO₂/pax/n.mile | 68 % ⚙️ |
| freight 🚛 | 48488 tonnes CO₂ | 76 kg·CO₂/m tonne/n.mile | 32 % ⚙️ |
| total | 151526 tonnes CO₂ | 1081 kg·CO₂/n.mile | 100% |
| 2021 yearly statistics | |
|---|---|
| distance travelled | 259531 km ⚙️ |
| time at sea | 5723 hours |
| 2021 average statistics per journey | |
|---|---|
| average persons transported 🙎♀️ | 335 persons ⚙️ |
| average freight transported 🚛 | 4549 metric tons ⚙️ |
| average speed | 45 km/h ⚙️ |
2021 monitoring methods:
N/A
2021 Theoretical
EIV (Efficiency Indicator Values): 19.21 gCO₂/ton/nautical mile
﹖ details
| 2020 yearly CO₂ Emissions | |||
|---|---|---|---|
| assigned to | total | average | ratio |
| persons 🙎♀️ | 90353 tonnes CO₂ | 3220 g·CO₂/pax/n.mile | 68 % ⚙️ |
| freight 🚛 | 41994 tonnes CO₂ | 79 kg·CO₂/m tonne/n.mile | 32 % ⚙️ |
| total | 132347 tonnes CO₂ | 1028 kg·CO₂/n.mile | 100% |
| 2020 yearly statistics | |
|---|---|
| distance travelled | 238520 km ⚙️ |
| time at sea | 5231 hours |
| 2020 average statistics per journey | |
|---|---|
| average persons transported 🙎♀️ | 218 persons ⚙️ |
| average freight transported 🚛 | 4113 metric tons ⚙️ |
| average speed | 46 km/h ⚙️ |
2020 monitoring methods:
N/A
2020 Theoretical
EIV (Efficiency Indicator Values): 19.21 gCO₂/ton/nautical mile
﹖ details
| 2019 yearly CO₂ Emissions | |||
|---|---|---|---|
| assigned to | total | average | ratio |
| persons 🙎♀️ | 74088 tonnes CO₂ | 1074 g·CO₂/pax/n.mile | 68 % ⚙️ |
| freight 🚛 | 34865 tonnes CO₂ | 76 kg·CO₂/m tonne/n.mile | 32 % ⚙️ |
| total | 108953 tonnes CO₂ | 1094 kg·CO₂/n.mile | 100% |
| 2019 yearly statistics | |
|---|---|
| distance travelled | 184461 km ⚙️ |
| time at sea | 3909 hours |
| 2019 average statistics per journey | |
|---|---|
| average persons transported 🙎♀️ | 692 persons ⚙️ |
| average freight transported 🚛 | 4583 metric tons ⚙️ |
| average speed | 47 km/h ⚙️ |
2019 monitoring methods:
N/A
2019 Theoretical
EIV (Efficiency Indicator Values): 19.21 gCO₂/ton/nautical mile
﹖ details
| 2018 yearly CO₂ Emissions | |||
|---|---|---|---|
| assigned to | total | average | ratio |
| persons 🙎♀️ | 100742 tonnes CO₂ | 809 g·CO₂/pax/n.mile | 68 % ⚙️ |
| freight 🚛 | 47408 tonnes CO₂ | 32 kg·CO₂/m tonne/n.mile | 32 % ⚙️ |
| total | 148150 tonnes CO₂ | 1030 kg·CO₂/n.mile | 100% |
| 2018 yearly statistics | |
|---|---|
| distance travelled | 266354 km ⚙️ |
| time at sea | 6120 hours |
| 2018 average statistics per journey | |
|---|---|
| average persons transported 🙎♀️ | 865 persons ⚙️ |
| average freight transported 🚛 | 10333 metric tons ⚙️ |
| average speed | 44 km/h ⚙️ |
2018 monitoring methods:
N/A
2018 Theoretical
EIV (Efficiency Indicator Values): 19.21 gCO₂/ton/nautical mile
﹖ details
ℹ️
Figures with the icon ⚙️ were computed based on the published data.
You can find computation details on
this page ↗
GreenFerries is a hobby project, all the data shown here has no official value. It is Open Source, so you can double check and modify it.

The Ecoscore compares
average CO₂ emissions per passenger per km.
‟emits like 2.1 planes” means that the ferry emits more than twice what an average plane would on the same distance for one passenger.