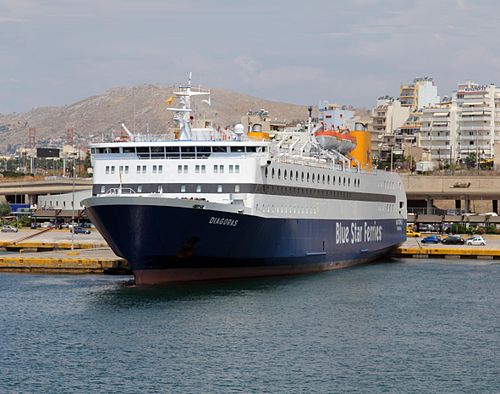
Diagoras

better than riding a car with a single passenger
(based on 2022 data)
Often travels on 0 routes
⚠️
Do you know of a route that this ship frequently travels but is not listed? Or have you noticed an error?
Please help by letting us know, thank you 🙇🏽♀️
Please help by letting us know, thank you 🙇🏽♀️
Ship Statistics
| 2022 yearly CO₂ Emissions | |||
|---|---|---|---|
| assigned to | total | average | ratio |
| persons 🙎♀️ | 10127 tonnes CO₂ | 330 g·CO₂/pax/n.mile | 45 % ⚙️ |
| freight 🚛 | 12517 tonnes CO₂ | 332 kg·CO₂/m tonne/n.mile | 55 % ⚙️ |
| total | 22644 tonnes CO₂ | 328 kg·CO₂/n.mile | 100% |
| 2022 yearly statistics | |
|---|---|
| distance travelled | 128014 km ⚙️ |
| time at sea | 3977 hours |
| 2022 average statistics per journey | |
|---|---|
| average persons transported 🙎♀️ | 444 persons ⚙️ |
| average freight transported 🚛 | 545 metric tons ⚙️ |
| average speed | 32 km/h ⚙️ |
2022 monitoring methods:
N/A
2022 Theoretical
EIV (Efficiency Indicator Values): 25.82 gCO₂/ton/nautical mile
﹖ details
| 2021 yearly CO₂ Emissions | |||
|---|---|---|---|
| assigned to | total | average | ratio |
| persons 🙎♀️ | 7113 tonnes CO₂ | 333 g·CO₂/pax/n.mile | 43 % ⚙️ |
| freight 🚛 | 9447 tonnes CO₂ | 339 kg·CO₂/m tonne/n.mile | 57 % ⚙️ |
| total | 16560 tonnes CO₂ | 335 kg·CO₂/n.mile | 100% |
| 2021 yearly statistics | |
|---|---|
| distance travelled | 91462 km ⚙️ |
| time at sea | 2832 hours |
| 2021 average statistics per journey | |
|---|---|
| average persons transported 🙎♀️ | 433 persons ⚙️ |
| average freight transported 🚛 | 564 metric tons ⚙️ |
| average speed | 32 km/h ⚙️ |
2021 monitoring methods:
N/A
2021 Theoretical
EIV (Efficiency Indicator Values): 25.82 gCO₂/ton/nautical mile
﹖ details
| 2020 yearly CO₂ Emissions | |||
|---|---|---|---|
| assigned to | total | average | ratio |
| persons 🙎♀️ | 2691 tonnes CO₂ | 191 g·CO₂/pax/n.mile | 18 % ⚙️ |
| freight 🚛 | 11933 tonnes CO₂ | 400 kg·CO₂/m tonne/n.mile | 82 % ⚙️ |
| total | 14624 tonnes CO₂ | 345 kg·CO₂/n.mile | 100% |
| 2020 yearly statistics | |
|---|---|
| distance travelled | 78483 km ⚙️ |
| time at sea | 2415 hours |
| 2020 average statistics per journey | |
|---|---|
| average persons transported 🙎♀️ | 333 persons ⚙️ |
| average freight transported 🚛 | 705 metric tons ⚙️ |
| average speed | 32 km/h ⚙️ |
2020 monitoring methods:
N/A
2020 Theoretical
EIV (Efficiency Indicator Values): 25.82 gCO₂/ton/nautical mile
﹖ details
| 2019 yearly CO₂ Emissions | |||
|---|---|---|---|
| assigned to | total | average | ratio |
| persons 🙎♀️ | 10356 tonnes CO₂ | 282 g·CO₂/pax/n.mile | 43 % ⚙️ |
| freight 🚛 | 13835 tonnes CO₂ | 360 kg·CO₂/m tonne/n.mile | 57 % ⚙️ |
| total | 24191 tonnes CO₂ | 341 kg·CO₂/n.mile | 100% |
| 2019 yearly statistics | |
|---|---|
| distance travelled | 131225 km ⚙️ |
| time at sea | 4046 hours |
| 2019 average statistics per journey | |
|---|---|
| average persons transported 🙎♀️ | 517 persons ⚙️ |
| average freight transported 🚛 | 542 metric tons ⚙️ |
| average speed | 32 km/h ⚙️ |
2019 monitoring methods:
N/A
2019 Theoretical
EIV (Efficiency Indicator Values): 25.82 gCO₂/ton/nautical mile
﹖ details
| 2018 yearly CO₂ Emissions | |||
|---|---|---|---|
| assigned to | total | average | ratio |
| persons 🙎♀️ | 10541 tonnes CO₂ | 982 g·CO₂/pax/n.mile | 62 % ⚙️ |
| freight 🚛 | 8382 tonnes CO₂ | 641 kg·CO₂/m tonne/n.mile | 38 % ⚙️ |
| total | 16907 tonnes CO₂ | 347 kg·CO₂/n.mile | 100% |
| 2018 yearly statistics | |
|---|---|
| distance travelled | 90180 km ⚙️ |
| time at sea | 2783 hours |
| 2018 average statistics per journey | |
|---|---|
| average persons transported 🙎♀️ | 220 persons ⚙️ |
| average freight transported 🚛 | 268 metric tons ⚙️ |
| average speed | 32 km/h ⚙️ |
2018 monitoring methods:
N/A
2018 Theoretical
EIV (Efficiency Indicator Values): 25.82 gCO₂/ton/nautical mile
﹖ details
ℹ️
Figures with the icon ⚙️ were computed based on the published data.
You can find computation details on
this page ↗
GreenFerries is a hobby project, all the data shown here has no official value. It is Open Source, so you can double check and modify it.

The Ecoscore compares
average CO₂ emissions per passenger per km.
‟emits like 2.1 planes” means that the ferry emits more than twice what an average plane would on the same distance for one passenger.