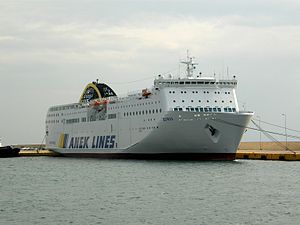
Elyros (ship)

better than riding a car with two passengers
(based on 2022 data)
Often travels on 1 routes
- Chania [GR] ↔ Le Pirée [GR] - 272 km
⚠️
Do you know of a route that this ship frequently travels but is not listed? Or have you noticed an error?
Please help by letting us know, thank you 🙇🏽♀️
Please help by letting us know, thank you 🙇🏽♀️
Ship Statistics
| 2022 yearly CO₂ Emissions | |||
|---|---|---|---|
| assigned to | total | average | ratio |
| persons 🙎♀️ | 931 tonnes CO₂ | 22 g·CO₂/pax/n.mile | 2 % ⚙️ |
| freight 🚛 | 48485 tonnes CO₂ | 207 kg·CO₂/m tonne/n.mile | 98 % ⚙️ |
| total | 53827 tonnes CO₂ | 685 kg·CO₂/n.mile | 100% |
| 2022 yearly statistics | |
|---|---|
| distance travelled | 145616 km ⚙️ |
| time at sea | 4117 hours |
| 2022 average statistics per journey | |
|---|---|
| average persons transported 🙎♀️ | 529 persons ⚙️ |
| average freight transported 🚛 | 2982 metric tons ⚙️ |
| average speed | 35 km/h ⚙️ |
2022 monitoring methods:
N/A
2022 Theoretical
EIV (Efficiency Indicator Values): 19.26 gCO₂/ton/nautical mile
﹖ details
| 2021 yearly CO₂ Emissions | |||
|---|---|---|---|
| assigned to | total | average | ratio |
| persons 🙎♀️ | 553 tonnes CO₂ | 18 g·CO₂/pax/n.mile | 1 % ⚙️ |
| freight 🚛 | 38877 tonnes CO₂ | 225 kg·CO₂/m tonne/n.mile | 99 % ⚙️ |
| total | 39430 tonnes CO₂ | 651 kg·CO₂/n.mile | 100% |
| 2021 yearly statistics | |
|---|---|
| distance travelled | 112214 km ⚙️ |
| time at sea | 3146 hours |
| 2021 average statistics per journey | |
|---|---|
| average persons transported 🙎♀️ | 513 persons ⚙️ |
| average freight transported 🚛 | 2851 metric tons ⚙️ |
| average speed | 36 km/h ⚙️ |
2021 monitoring methods:
N/A
2021 Theoretical
EIV (Efficiency Indicator Values): 19.26 gCO₂/ton/nautical mile
﹖ details
| 2020 yearly CO₂ Emissions | |||
|---|---|---|---|
| assigned to | total | average | ratio |
| persons 🙎♀️ | 453 tonnes CO₂ | 21 g·CO₂/pax/n.mile | 1 % ⚙️ |
| freight 🚛 | 35731 tonnes CO₂ | 217 kg·CO₂/m tonne/n.mile | 99 % ⚙️ |
| total | 36184 tonnes CO₂ | 585 kg·CO₂/n.mile | 100% |
| 2020 yearly statistics | |
|---|---|
| distance travelled | 114537 km ⚙️ |
| time at sea | 3196 hours |
| 2020 average statistics per journey | |
|---|---|
| average persons transported 🙎♀️ | 344 persons ⚙️ |
| average freight transported 🚛 | 2658 metric tons ⚙️ |
| average speed | 36 km/h ⚙️ |
2020 monitoring methods:
N/A
2020 Theoretical
EIV (Efficiency Indicator Values): 19.26 gCO₂/ton/nautical mile
﹖ details
| 2019 yearly CO₂ Emissions | |||
|---|---|---|---|
| assigned to | total | average | ratio |
| persons 🙎♀️ | 1017 tonnes CO₂ | 20 g·CO₂/pax/n.mile | 2 % ⚙️ |
| freight 🚛 | 45826 tonnes CO₂ | 331 kg·CO₂/m tonne/n.mile | 98 % ⚙️ |
| total | 46843 tonnes CO₂ | 665 kg·CO₂/n.mile | 100% |
| 2019 yearly statistics | |
|---|---|
| distance travelled | 130401 km ⚙️ |
| time at sea | 3526 hours |
| 2019 average statistics per journey | |
|---|---|
| average persons transported 🙎♀️ | 719 persons ⚙️ |
| average freight transported 🚛 | 1965 metric tons ⚙️ |
| average speed | 37 km/h ⚙️ |
2019 monitoring methods:
N/A
2019 Theoretical
EIV (Efficiency Indicator Values): 19.26 gCO₂/ton/nautical mile
﹖ details
| 2018 yearly CO₂ Emissions | |||
|---|---|---|---|
| assigned to | total | average | ratio |
| persons 🙎♀️ | 1164 tonnes CO₂ | 21 g·CO₂/pax/n.mile | 2 % ⚙️ |
| freight 🚛 | 50909 tonnes CO₂ | 291 kg·CO₂/m tonne/n.mile | 98 % ⚙️ |
| total | 52073 tonnes CO₂ | 622 kg·CO₂/n.mile | 100% |
| 2018 yearly statistics | |
|---|---|
| distance travelled | 155151 km ⚙️ |
| time at sea | 4204 hours |
| 2018 average statistics per journey | |
|---|---|
| average persons transported 🙎♀️ | 651 persons ⚙️ |
| average freight transported 🚛 | 2085 metric tons ⚙️ |
| average speed | 37 km/h ⚙️ |
2018 monitoring methods:
N/A
2018 Theoretical
EIV (Efficiency Indicator Values): 19.26 gCO₂/ton/nautical mile
﹖ details
ℹ️
Figures with the icon ⚙️ were computed based on the published data.
You can find computation details on
this page ↗
GreenFerries is a hobby project, all the data shown here has no official value. It is Open Source, so you can double check and modify it.

The Ecoscore compares
average CO₂ emissions per passenger per km.
‟emits like 2.1 planes” means that the ferry emits more than twice what an average plane would on the same distance for one passenger.