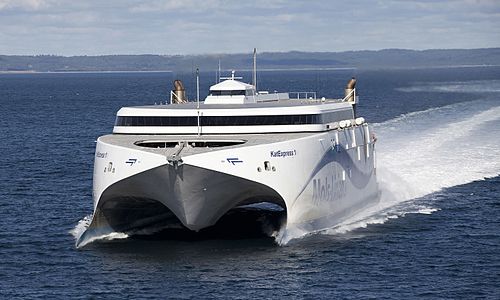
HSC Express 1

2 to 4 times an average plane's emissions
(based on 2022 data)
Often travels on 0 routes
⚠️
Do you know of a route that this ship frequently travels but is not listed? Or have you noticed an error?
Please help by letting us know, thank you 🙇🏽♀️
Please help by letting us know, thank you 🙇🏽♀️
Ship Statistics
| 2022 yearly CO₂ Emissions | |||
|---|---|---|---|
| assigned to | total | average | ratio |
| persons 🙎♀️ | 50011 tonnes CO₂ | 990 g·CO₂/pax/n.mile | 95 % ⚙️ |
| freight 🚛 | 3473 tonnes CO₂ | 96 kg·CO₂/m tonne/n.mile | 5 % ⚙️ |
| total | 52889 tonnes CO₂ | 497 kg·CO₂/n.mile | 100% |
| 2022 yearly statistics | |
|---|---|
| distance travelled | 197183 km ⚙️ |
| time at sea | 3731 hours |
| 2022 average statistics per journey | |
|---|---|
| average persons transported 🙎♀️ | 474 persons ⚙️ |
| average freight transported 🚛 | 339 metric tons ⚙️ |
| average speed | 53 km/h ⚙️ |
2022 monitoring methods:
N/A
2022 Theoretical
EIV (Efficiency Indicator Values): 1.94 gCO₂/ton/nautical mile
﹖ details
| 2021 yearly CO₂ Emissions | |||
|---|---|---|---|
| assigned to | total | average | ratio |
| persons 🙎♀️ | 47066 tonnes CO₂ | 1078 g·CO₂/pax/n.mile | 94 % ⚙️ |
| freight 🚛 | 3673 tonnes CO₂ | 110 kg·CO₂/m tonne/n.mile | 6 % ⚙️ |
| total | 50117 tonnes CO₂ | 501 kg·CO₂/n.mile | 100% |
| 2021 yearly statistics | |
|---|---|
| distance travelled | 185339 km ⚙️ |
| time at sea | 3509 hours |
| 2021 average statistics per journey | |
|---|---|
| average persons transported 🙎♀️ | 436 persons ⚙️ |
| average freight transported 🚛 | 332 metric tons ⚙️ |
| average speed | 53 km/h ⚙️ |
2021 monitoring methods:
N/A
2021 Theoretical
EIV (Efficiency Indicator Values): 1.94 gCO₂/ton/nautical mile
﹖ details
| 2020 yearly CO₂ Emissions | |||
|---|---|---|---|
| assigned to | total | average | ratio |
| persons 🙎♀️ | 46723 tonnes CO₂ | 1217 g·CO₂/pax/n.mile | 93 % ⚙️ |
| freight 🚛 | 3420 tonnes CO₂ | 114 kg·CO₂/m tonne/n.mile | 7 % ⚙️ |
| total | 50143 tonnes CO₂ | 500 kg·CO₂/n.mile | 100% |
| 2020 yearly statistics | |
|---|---|
| distance travelled | 185917 km ⚙️ |
| time at sea | 3517 hours |
| 2020 average statistics per journey | |
|---|---|
| average persons transported 🙎♀️ | 382 persons ⚙️ |
| average freight transported 🚛 | 300 metric tons ⚙️ |
| average speed | 53 km/h ⚙️ |
2020 monitoring methods:
N/A
2020 Theoretical
EIV (Efficiency Indicator Values): 1.94 gCO₂/ton/nautical mile
﹖ details
| 2019 yearly CO₂ Emissions | |||
|---|---|---|---|
| assigned to | total | average | ratio |
| persons 🙎♀️ | 49754 tonnes CO₂ | 991 g·CO₂/pax/n.mile | 93 % ⚙️ |
| freight 🚛 | 4194 tonnes CO₂ | 121 kg·CO₂/m tonne/n.mile | 7 % ⚙️ |
| total | 53346 tonnes CO₂ | 497 kg·CO₂/n.mile | 100% |
| 2019 yearly statistics | |
|---|---|
| distance travelled | 198701 km ⚙️ |
| time at sea | 3671 hours |
| 2019 average statistics per journey | |
|---|---|
| average persons transported 🙎♀️ | 468 persons ⚙️ |
| average freight transported 🚛 | 324 metric tons ⚙️ |
| average speed | 54 km/h ⚙️ |
2019 monitoring methods:
N/A
2019 Theoretical
EIV (Efficiency Indicator Values): 1.94 gCO₂/ton/nautical mile
﹖ details
| 2018 yearly CO₂ Emissions | |||
|---|---|---|---|
| assigned to | total | average | ratio |
| persons 🙎♀️ | 37004 tonnes CO₂ | 1031 g·CO₂/pax/n.mile | 96 % ⚙️ |
| freight 🚛 | 2157 tonnes CO₂ | 83 kg·CO₂/m tonne/n.mile | 4 % ⚙️ |
| total | 38458 tonnes CO₂ | 473 kg·CO₂/n.mile | 100% |
| 2018 yearly statistics | |
|---|---|
| distance travelled | 150669 km ⚙️ |
| time at sea | 2816 hours |
| 2018 average statistics per journey | |
|---|---|
| average persons transported 🙎♀️ | 441 persons ⚙️ |
| average freight transported 🚛 | 319 metric tons ⚙️ |
| average speed | 54 km/h ⚙️ |
2018 monitoring methods:
N/A
2018 Theoretical
EIV (Efficiency Indicator Values): 1.94 gCO₂/ton/nautical mile
﹖ details
ℹ️
Figures with the icon ⚙️ were computed based on the published data.
You can find computation details on
this page ↗
GreenFerries is a hobby project, all the data shown here has no official value. It is Open Source, so you can double check and modify it.

The Ecoscore compares
average CO₂ emissions per passenger per km.
‟emits like 2.1 planes” means that the ferry emits more than twice what an average plane would on the same distance for one passenger.