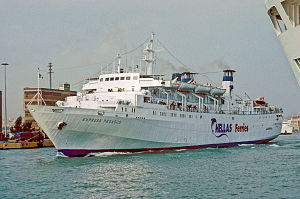
Express Pegasus

2 to 4 times an average plane's emissions
(based on 2020 data)
Often travels on 1 routes
⚠️
Do you know of a route that this ship frequently travels but is not listed? Or have you noticed an error?
Please help by letting us know, thank you 🙇🏽♀️
Please help by letting us know, thank you 🙇🏽♀️
Ship Statistics
| 2022 yearly CO₂ Emissions | |||
|---|---|---|---|
| assigned to | total | average | ratio |
| persons 🙎♀️ | N/A | N/A | N/A |
| freight 🚛 | N/A | N/A | N/A |
| total | N/A | N/A | 100% |
| 2022 yearly statistics | |
|---|---|
| distance travelled | N/A |
| time at sea | N/A |
| 2022 average statistics per journey | |
|---|---|
| average persons transported 🙎♀️ | N/A |
| average freight transported 🚛 | N/A |
| average speed | N/A |
2022 monitoring methods:
N/A
2022 Theoretical
N/A
﹖ details
| 2021 yearly CO₂ Emissions | |||
|---|---|---|---|
| assigned to | total | average | ratio |
| persons 🙎♀️ | N/A | N/A | N/A |
| freight 🚛 | N/A | N/A | N/A |
| total | N/A | N/A | 100% |
| 2021 yearly statistics | |
|---|---|
| distance travelled | N/A |
| time at sea | N/A |
| 2021 average statistics per journey | |
|---|---|
| average persons transported 🙎♀️ | N/A |
| average freight transported 🚛 | N/A |
| average speed | N/A |
2021 monitoring methods:
N/A
2021 Theoretical
N/A
﹖ details
| 2020 yearly CO₂ Emissions | |||
|---|---|---|---|
| assigned to | total | average | ratio |
| persons 🙎♀️ | 1362 tonnes CO₂ | 965 g·CO₂/pax/n.mile | 41 % ⚙️ |
| freight 🚛 | 1998 tonnes CO₂ | 1174 kg·CO₂/m tonne/n.mile | 59 % ⚙️ |
| total | 3359 tonnes CO₂ | 280 kg·CO₂/n.mile | 100% |
| 2020 yearly statistics | |
|---|---|
| distance travelled | 22200 km ⚙️ |
| time at sea | 837 hours |
| 2020 average statistics per journey | |
|---|---|
| average persons transported 🙎♀️ | 118 persons ⚙️ |
| average freight transported 🚛 | 142 metric tons ⚙️ |
| average speed | 27 km/h ⚙️ |
2020 monitoring methods:
N/A
2020 Theoretical
EIV (Efficiency Indicator Values): 78.24 gCO₂/ton/nautical mile
﹖ details
| 2019 yearly CO₂ Emissions | |||
|---|---|---|---|
| assigned to | total | average | ratio |
| persons 🙎♀️ | 9359 tonnes CO₂ | 591 g·CO₂/pax/n.mile | 50 % ⚙️ |
| freight 🚛 | 9462 tonnes CO₂ | 669 kg·CO₂/m tonne/n.mile | 50 % ⚙️ |
| total | 18822 tonnes CO₂ | 279 kg·CO₂/n.mile | 100% |
| 2019 yearly statistics | |
|---|---|
| distance travelled | 125052 km ⚙️ |
| time at sea | 4440 hours |
| 2019 average statistics per journey | |
|---|---|
| average persons transported 🙎♀️ | 234 persons ⚙️ |
| average freight transported 🚛 | 209 metric tons ⚙️ |
| average speed | 28 km/h ⚙️ |
2019 monitoring methods:
N/A
2019 Theoretical
EIV (Efficiency Indicator Values): 78.24 gCO₂/ton/nautical mile
﹖ details
| 2018 yearly CO₂ Emissions | |||
|---|---|---|---|
| assigned to | total | average | ratio |
| persons 🙎♀️ | 7355 tonnes CO₂ | 441 g·CO₂/pax/n.mile | 46 % ⚙️ |
| freight 🚛 | 8548 tonnes CO₂ | 1100 kg·CO₂/m tonne/n.mile | 54 % ⚙️ |
| total | 15902 tonnes CO₂ | 220 kg·CO₂/n.mile | 100% |
| 2018 yearly statistics | |
|---|---|
| distance travelled | 133814 km ⚙️ |
| time at sea | 3530 hours |
| 2018 average statistics per journey | |
|---|---|
| average persons transported 🙎♀️ | 231 persons ⚙️ |
| average freight transported 🚛 | 108 metric tons ⚙️ |
| average speed | 38 km/h ⚙️ |
2018 monitoring methods:
N/A
2018 Theoretical
EIV (Efficiency Indicator Values): 78.24 gCO₂/ton/nautical mile
﹖ details
ℹ️
Figures with the icon ⚙️ were computed based on the published data.
You can find computation details on
this page ↗
GreenFerries is a hobby project, all the data shown here has no official value. It is Open Source, so you can double check and modify it.

The Ecoscore compares
average CO₂ emissions per passenger per km.
‟emits like 2.1 planes” means that the ferry emits more than twice what an average plane would on the same distance for one passenger.