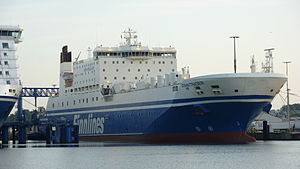
Finntrader

better than riding a car with two passengers
(based on 2022 data)
Often travels on 3 routes
- Lübeck [DE] ↔ Malmo [SE] - 243 km
- Lübeck [DE] ↔ Travemunde [DE] - 15 km
- Travemunde [DE] ↔ Malmo [SE] - 228 km
⚠️
Do you know of a route that this ship frequently travels but is not listed? Or have you noticed an error?
Please help by letting us know, thank you 🙇🏽♀️
Please help by letting us know, thank you 🙇🏽♀️
Ship Statistics
| 2022 yearly CO₂ Emissions | |||
|---|---|---|---|
| assigned to | total | average | ratio |
| persons 🙎♀️ | 761 tonnes CO₂ | 61 g·CO₂/pax/n.mile | 2 % ⚙️ |
| freight 🚛 | 42451 tonnes CO₂ | 128 kg·CO₂/m tonne/n.mile | 98 % ⚙️ |
| total | 43212 tonnes CO₂ | 475 kg·CO₂/n.mile | 100% |
| 2022 yearly statistics | |
|---|---|
| distance travelled | 168621 km ⚙️ |
| time at sea | 5903 hours |
| 2022 average statistics per journey | |
|---|---|
| average persons transported 🙎♀️ | 138 persons ⚙️ |
| average freight transported 🚛 | 3646 metric tons ⚙️ |
| average speed | 29 km/h ⚙️ |
2022 monitoring methods:
N/A
2022 Theoretical
EIV (Efficiency Indicator Values): 4.96 gCO₂/ton/nautical mile
﹖ details
| 2021 yearly CO₂ Emissions | |||
|---|---|---|---|
| assigned to | total | average | ratio |
| persons 🙎♀️ | 855 tonnes CO₂ | 67 g·CO₂/pax/n.mile | 2 % ⚙️ |
| freight 🚛 | 41915 tonnes CO₂ | 125 kg·CO₂/m tonne/n.mile | 98 % ⚙️ |
| total | 42770 tonnes CO₂ | 467 kg·CO₂/n.mile | 100% |
| 2021 yearly statistics | |
|---|---|
| distance travelled | 169479 km ⚙️ |
| time at sea | 5920 hours |
| 2021 average statistics per journey | |
|---|---|
| average persons transported 🙎♀️ | 140 persons ⚙️ |
| average freight transported 🚛 | 3673 metric tons ⚙️ |
| average speed | 29 km/h ⚙️ |
2021 monitoring methods:
N/A
2021 Theoretical
EIV (Efficiency Indicator Values): 4.96 gCO₂/ton/nautical mile
﹖ details
| 2020 yearly CO₂ Emissions | |||
|---|---|---|---|
| assigned to | total | average | ratio |
| persons 🙎♀️ | 786 tonnes CO₂ | 67 g·CO₂/pax/n.mile | 2 % ⚙️ |
| freight 🚛 | 38496 tonnes CO₂ | 127 kg·CO₂/m tonne/n.mile | 98 % ⚙️ |
| total | 39282 tonnes CO₂ | 439 kg·CO₂/n.mile | 100% |
| 2020 yearly statistics | |
|---|---|
| distance travelled | 165621 km ⚙️ |
| time at sea | 5828 hours |
| 2020 average statistics per journey | |
|---|---|
| average persons transported 🙎♀️ | 130 persons ⚙️ |
| average freight transported 🚛 | 3387 metric tons ⚙️ |
| average speed | 28 km/h ⚙️ |
2020 monitoring methods:
N/A
2020 Theoretical
EIV (Efficiency Indicator Values): 4.96 gCO₂/ton/nautical mile
﹖ details
| 2019 yearly CO₂ Emissions | |||
|---|---|---|---|
| assigned to | total | average | ratio |
| persons 🙎♀️ | 1725 tonnes CO₂ | 128 g·CO₂/pax/n.mile | 4 % ⚙️ |
| freight 🚛 | 38824 tonnes CO₂ | 118 kg·CO₂/m tonne/n.mile | 96 % ⚙️ |
| total | 40549 tonnes CO₂ | 437 kg·CO₂/n.mile | 100% |
| 2019 yearly statistics | |
|---|---|
| distance travelled | 171953 km ⚙️ |
| time at sea | 6049 hours |
| 2019 average statistics per journey | |
|---|---|
| average persons transported 🙎♀️ | 145 persons ⚙️ |
| average freight transported 🚛 | 3533 metric tons ⚙️ |
| average speed | 28 km/h ⚙️ |
2019 monitoring methods:
N/A
2019 Theoretical
EIV (Efficiency Indicator Values): 4.96 gCO₂/ton/nautical mile
﹖ details
| 2018 yearly CO₂ Emissions | |||
|---|---|---|---|
| assigned to | total | average | ratio |
| persons 🙎♀️ | 1218 tonnes CO₂ | 93 g·CO₂/pax/n.mile | 3 % ⚙️ |
| freight 🚛 | 38692 tonnes CO₂ | 118 kg·CO₂/m tonne/n.mile | 97 % ⚙️ |
| total | 38692 tonnes CO₂ | 440 kg·CO₂/n.mile | 100% |
| 2018 yearly statistics | |
|---|---|
| distance travelled | 162744 km ⚙️ |
| time at sea | 5713 hours |
| 2018 average statistics per journey | |
|---|---|
| average persons transported 🙎♀️ | 148 persons ⚙️ |
| average freight transported 🚛 | 3721 metric tons ⚙️ |
| average speed | 28 km/h ⚙️ |
2018 monitoring methods:
N/A
2018 Theoretical
EIV (Efficiency Indicator Values): 15.42 gCO₂/ton/nautical mile
﹖ details
ℹ️
Figures with the icon ⚙️ were computed based on the published data.
You can find computation details on
this page ↗
GreenFerries is a hobby project, all the data shown here has no official value. It is Open Source, so you can double check and modify it.

The Ecoscore compares
average CO₂ emissions per passenger per km.
‟emits like 2.1 planes” means that the ferry emits more than twice what an average plane would on the same distance for one passenger.