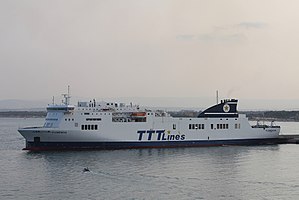
Florencia

over 4 times an average plane's emissions
(based on 2022 data)
Often travels on 2 routes
- Naples [IT] ↔ Catania [IT] - 380 km
- Salerno [IT] ↔ Messina [IT] - 283 km
⚠️
Do you know of a route that this ship frequently travels but is not listed? Or have you noticed an error?
Please help by letting us know, thank you 🙇🏽♀️
Please help by letting us know, thank you 🙇🏽♀️
Ship Statistics
| 2022 yearly CO₂ Emissions | |||
|---|---|---|---|
| assigned to | total | average | ratio |
| persons 🙎♀️ | 31798 tonnes CO₂ | 1244 g·CO₂/pax/n.mile | 57 % ⚙️ |
| freight 🚛 | 23988 tonnes CO₂ | 66 kg·CO₂/m tonne/n.mile | 43 % ⚙️ |
| total | 55786 tonnes CO₂ | 480 kg·CO₂/n.mile | 100% |
| 2022 yearly statistics | |
|---|---|
| distance travelled | 215224 km ⚙️ |
| time at sea | 6222 hours |
| 2022 average statistics per journey | |
|---|---|
| average persons transported 🙎♀️ | 220 persons ⚙️ |
| average freight transported 🚛 | 3117 metric tons ⚙️ |
| average speed | 35 km/h ⚙️ |
2022 monitoring methods:
N/A
2022 Theoretical
EIV (Efficiency Indicator Values): 19.73 gCO₂/ton/nautical mile
﹖ details
| 2021 yearly CO₂ Emissions | |||
|---|---|---|---|
| assigned to | total | average | ratio |
| persons 🙎♀️ | 36943 tonnes CO₂ | 2446 g·CO₂/pax/n.mile | 57 % ⚙️ |
| freight 🚛 | 27869 tonnes CO₂ | 73 kg·CO₂/m tonne/n.mile | 43 % ⚙️ |
| total | 64812 tonnes CO₂ | 482 kg·CO₂/n.mile | 100% |
| 2021 yearly statistics | |
|---|---|
| distance travelled | 249042 km ⚙️ |
| time at sea | 6684 hours |
| 2021 average statistics per journey | |
|---|---|
| average persons transported 🙎♀️ | 112 persons ⚙️ |
| average freight transported 🚛 | 2844 metric tons ⚙️ |
| average speed | 37 km/h ⚙️ |
2021 monitoring methods:
N/A
2021 Theoretical
EIV (Efficiency Indicator Values): 19.73 gCO₂/ton/nautical mile
﹖ details
| 2020 yearly CO₂ Emissions | |||
|---|---|---|---|
| assigned to | total | average | ratio |
| persons 🙎♀️ | 22659 tonnes CO₂ | 3657 g·CO₂/pax/n.mile | 57 % ⚙️ |
| freight 🚛 | 17093 tonnes CO₂ | 83 kg·CO₂/m tonne/n.mile | 43 % ⚙️ |
| total | 39752 tonnes CO₂ | 496 kg·CO₂/n.mile | 100% |
| 2020 yearly statistics | |
|---|---|
| distance travelled | 148486 km ⚙️ |
| time at sea | 4348 hours |
| 2020 average statistics per journey | |
|---|---|
| average persons transported 🙎♀️ | 77 persons ⚙️ |
| average freight transported 🚛 | 2582 metric tons ⚙️ |
| average speed | 34 km/h ⚙️ |
2020 monitoring methods:
N/A
2020 Theoretical
EIV (Efficiency Indicator Values): 19.73 gCO₂/ton/nautical mile
﹖ details
| 2019 yearly CO₂ Emissions | |||
|---|---|---|---|
| assigned to | total | average | ratio |
| persons 🙎♀️ | 14550 tonnes CO₂ | 1127 g·CO₂/pax/n.mile | 57 % ⚙️ |
| freight 🚛 | 10977 tonnes CO₂ | 81 kg·CO₂/m tonne/n.mile | 43 % ⚙️ |
| total | 25527 tonnes CO₂ | 562 kg·CO₂/n.mile | 100% |
| 2019 yearly statistics | |
|---|---|
| distance travelled | 84143 km ⚙️ |
| time at sea | 2379 hours |
| 2019 average statistics per journey | |
|---|---|
| average persons transported 🙎♀️ | 284 persons ⚙️ |
| average freight transported 🚛 | 3000 metric tons ⚙️ |
| average speed | 35 km/h ⚙️ |
2019 monitoring methods:
N/A
2019 Theoretical
EIV (Efficiency Indicator Values): 19.73 gCO₂/ton/nautical mile
﹖ details
| 2018 yearly CO₂ Emissions | |||
|---|---|---|---|
| assigned to | total | average | ratio |
| persons 🙎♀️ | 18313 tonnes CO₂ | 461 g·CO₂/pax/n.mile | 57 % ⚙️ |
| freight 🚛 | 13815 tonnes CO₂ | 89 kg·CO₂/m tonne/n.mile | 43 % ⚙️ |
| total | 32128 tonnes CO₂ | 526 kg·CO₂/n.mile | 100% |
| 2018 yearly statistics | |
|---|---|
| distance travelled | 113105 km ⚙️ |
| time at sea | 3152 hours |
| 2018 average statistics per journey | |
|---|---|
| average persons transported 🙎♀️ | 651 persons ⚙️ |
| average freight transported 🚛 | 2556 metric tons ⚙️ |
| average speed | 36 km/h ⚙️ |
2018 monitoring methods:
N/A
2018 Theoretical
EIV (Efficiency Indicator Values): 19.73 gCO₂/ton/nautical mile
﹖ details
ℹ️
Figures with the icon ⚙️ were computed based on the published data.
You can find computation details on
this page ↗
GreenFerries is a hobby project, all the data shown here has no official value. It is Open Source, so you can double check and modify it.

The Ecoscore compares
average CO₂ emissions per passenger per km.
‟emits like 2.1 planes” means that the ferry emits more than twice what an average plane would on the same distance for one passenger.