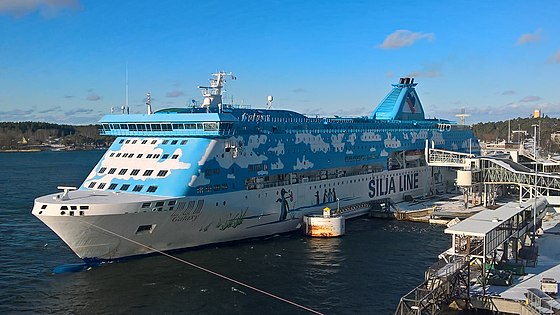
Galaxy

2 to 4 times an average plane's emissions
(based on 2022 data)
Often travels on 0 routes
⚠️
Do you know of a route that this ship frequently travels but is not listed? Or have you noticed an error?
Please help by letting us know, thank you 🙇🏽♀️
Please help by letting us know, thank you 🙇🏽♀️
Ship Statistics
| 2022 yearly CO₂ Emissions | |||
|---|---|---|---|
| assigned to | total | average | ratio |
| persons 🙎♀️ | 41092 tonnes CO₂ | 744 g·CO₂/pax/n.mile | 80 % ⚙️ |
| freight 🚛 | 5267 tonnes CO₂ | 60 kg·CO₂/m tonne/n.mile | 20 % ⚙️ |
| total | 51548 tonnes CO₂ | 627 kg·CO₂/n.mile | 100% |
| 2022 yearly statistics | |
|---|---|
| distance travelled | 152152 km ⚙️ |
| time at sea | 5347 hours |
| 2022 average statistics per journey | |
|---|---|
| average persons transported 🙎♀️ | 672 persons ⚙️ |
| average freight transported 🚛 | 1060 metric tons ⚙️ |
| average speed | 28 km/h ⚙️ |
2022 monitoring methods:
N/A
2022 Theoretical
EIV (Efficiency Indicator Values): 2.98 gCO₂/ton/nautical mile
﹖ details
| 2021 yearly CO₂ Emissions | |||
|---|---|---|---|
| assigned to | total | average | ratio |
| persons 🙎♀️ | 55154 tonnes CO₂ | 1370 g·CO₂/pax/n.mile | 83 % ⚙️ |
| freight 🚛 | 8806 tonnes CO₂ | 69 kg·CO₂/m tonne/n.mile | 17 % ⚙️ |
| total | 66155 tonnes CO₂ | 567 kg·CO₂/n.mile | 100% |
| 2021 yearly statistics | |
|---|---|
| distance travelled | 216027 km ⚙️ |
| time at sea | 7558 hours |
| 2021 average statistics per journey | |
|---|---|
| average persons transported 🙎♀️ | 345 persons ⚙️ |
| average freight transported 🚛 | 1087 metric tons ⚙️ |
| average speed | 29 km/h ⚙️ |
2021 monitoring methods:
N/A
2021 Theoretical
EIV (Efficiency Indicator Values): 2.98 gCO₂/ton/nautical mile
﹖ details
| 2020 yearly CO₂ Emissions | |||
|---|---|---|---|
| assigned to | total | average | ratio |
| persons 🙎♀️ | 56158 tonnes CO₂ | 1476 g·CO₂/pax/n.mile | 84 % ⚙️ |
| freight 🚛 | 9153 tonnes CO₂ | 75 kg·CO₂/m tonne/n.mile | 16 % ⚙️ |
| total | 66968 tonnes CO₂ | 565 kg·CO₂/n.mile | 100% |
| 2020 yearly statistics | |
|---|---|
| distance travelled | 219698 km ⚙️ |
| time at sea | 7750 hours |
| 2020 average statistics per journey | |
|---|---|
| average persons transported 🙎♀️ | 321 persons ⚙️ |
| average freight transported 🚛 | 1025 metric tons ⚙️ |
| average speed | 28 km/h ⚙️ |
2020 monitoring methods:
N/A
2020 Theoretical
EIV (Efficiency Indicator Values): 2.98 gCO₂/ton/nautical mile
﹖ details
| 2019 yearly CO₂ Emissions | |||
|---|---|---|---|
| assigned to | total | average | ratio |
| persons 🙎♀️ | 57399 tonnes CO₂ | 500 g·CO₂/pax/n.mile | 86 % ⚙️ |
| freight 🚛 | 7051 tonnes CO₂ | 62 kg·CO₂/m tonne/n.mile | 14 % ⚙️ |
| total | 66709 tonnes CO₂ | 588 kg·CO₂/n.mile | 100% |
| 2019 yearly statistics | |
|---|---|
| distance travelled | 210069 km ⚙️ |
| time at sea | 7339 hours |
| 2019 average statistics per journey | |
|---|---|
| average persons transported 🙎♀️ | 1012 persons ⚙️ |
| average freight transported 🚛 | 995 metric tons ⚙️ |
| average speed | 29 km/h ⚙️ |
2019 monitoring methods:
N/A
2019 Theoretical
EIV (Efficiency Indicator Values): 2.98 gCO₂/ton/nautical mile
﹖ details
| 2018 yearly CO₂ Emissions | |||
|---|---|---|---|
| assigned to | total | average | ratio |
| persons 🙎♀️ | 55428 tonnes CO₂ | 501 g·CO₂/pax/n.mile | 82 % ⚙️ |
| freight 🚛 | 6941 tonnes CO₂ | 65 kg·CO₂/m tonne/n.mile | 18 % ⚙️ |
| total | 67675 tonnes CO₂ | 577 kg·CO₂/n.mile | 100% |
| 2018 yearly statistics | |
|---|---|
| distance travelled | 217299 km ⚙️ |
| time at sea | 7876 hours |
| 2018 average statistics per journey | |
|---|---|
| average persons transported 🙎♀️ | 943 persons ⚙️ |
| average freight transported 🚛 | 916 metric tons ⚙️ |
| average speed | 28 km/h ⚙️ |
2018 monitoring methods:
N/A
2018 Theoretical
EIV (Efficiency Indicator Values): 2.79 gCO₂/ton/nautical mile
﹖ details
ℹ️
Figures with the icon ⚙️ were computed based on the published data.
You can find computation details on
this page ↗
GreenFerries is a hobby project, all the data shown here has no official value. It is Open Source, so you can double check and modify it.

The Ecoscore compares
average CO₂ emissions per passenger per km.
‟emits like 2.1 planes” means that the ferry emits more than twice what an average plane would on the same distance for one passenger.