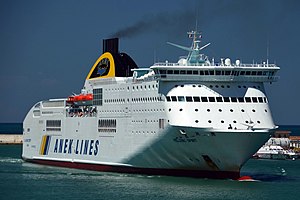
Hellenic Spirit

better than riding a car with two passengers
(based on 2022 data)
Often travels on 2 routes
- Ancona [IT] ↔ Igoumenitsa [GR] - 723 km
- Ancona [IT] ↔ Patras [GR] - 912 km
⚠️
Do you know of a route that this ship frequently travels but is not listed? Or have you noticed an error?
Please help by letting us know, thank you 🙇🏽♀️
Please help by letting us know, thank you 🙇🏽♀️
Ship Statistics
| 2022 yearly CO₂ Emissions | |||
|---|---|---|---|
| assigned to | total | average | ratio |
| persons 🙎♀️ | 1187 tonnes CO₂ | 15 g·CO₂/pax/n.mile | 1 % ⚙️ |
| freight 🚛 | 89681 tonnes CO₂ | 200 kg·CO₂/m tonne/n.mile | 99 % ⚙️ |
| total | 91726 tonnes CO₂ | 725 kg·CO₂/n.mile | 100% |
| 2022 yearly statistics | |
|---|---|
| distance travelled | 234381 km ⚙️ |
| time at sea | 5609 hours |
| 2022 average statistics per journey | |
|---|---|
| average persons transported 🙎♀️ | 632 persons ⚙️ |
| average freight transported 🚛 | 3548 metric tons ⚙️ |
| average speed | 42 km/h ⚙️ |
2022 monitoring methods:
N/A
2022 Theoretical
EIV (Efficiency Indicator Values): 20.55 gCO₂/ton/nautical mile
﹖ details
| 2021 yearly CO₂ Emissions | |||
|---|---|---|---|
| assigned to | total | average | ratio |
| persons 🙎♀️ | 976 tonnes CO₂ | 17 g·CO₂/pax/n.mile | 0.9441107265472065 % ⚙️ |
| freight 🚛 | 102408 tonnes CO₂ | 224 kg·CO₂/m tonne/n.mile | 99 % ⚙️ |
| total | 103384 tonnes CO₂ | 745 kg·CO₂/n.mile | 100% |
| 2021 yearly statistics | |
|---|---|
| distance travelled | 256858 km ⚙️ |
| time at sea | 6417 hours |
| 2021 average statistics per journey | |
|---|---|
| average persons transported 🙎♀️ | 419 persons ⚙️ |
| average freight transported 🚛 | 3303 metric tons ⚙️ |
| average speed | 40 km/h ⚙️ |
2021 monitoring methods:
N/A
2021 Theoretical
EIV (Efficiency Indicator Values): 20.55 gCO₂/ton/nautical mile
﹖ details
| 2020 yearly CO₂ Emissions | |||
|---|---|---|---|
| assigned to | total | average | ratio |
| persons 🙎♀️ | 475 tonnes CO₂ | 16 g·CO₂/pax/n.mile | 0.5679059745488275 % ⚙️ |
| freight 🚛 | 83132 tonnes CO₂ | 227 kg·CO₂/m tonne/n.mile | 99 % ⚙️ |
| total | 83607 tonnes CO₂ | 699 kg·CO₂/n.mile | 100% |
| 2020 yearly statistics | |
|---|---|
| distance travelled | 221638 km ⚙️ |
| time at sea | 5386 hours |
| 2020 average statistics per journey | |
|---|---|
| average persons transported 🙎♀️ | 251 persons ⚙️ |
| average freight transported 🚛 | 3066 metric tons ⚙️ |
| average speed | 41 km/h ⚙️ |
2020 monitoring methods:
N/A
2020 Theoretical
EIV (Efficiency Indicator Values): 20.55 gCO₂/ton/nautical mile
﹖ details
| 2019 yearly CO₂ Emissions | |||
|---|---|---|---|
| assigned to | total | average | ratio |
| persons 🙎♀️ | 1254 tonnes CO₂ | 16 g·CO₂/pax/n.mile | 1 % ⚙️ |
| freight 🚛 | 103306 tonnes CO₂ | 213 kg·CO₂/m tonne/n.mile | 99 % ⚙️ |
| total | 104561 tonnes CO₂ | 791 kg·CO₂/n.mile | 100% |
| 2019 yearly statistics | |
|---|---|
| distance travelled | 244710 km ⚙️ |
| time at sea | 5873 hours |
| 2019 average statistics per journey | |
|---|---|
| average persons transported 🙎♀️ | 603 persons ⚙️ |
| average freight transported 🚛 | 3669 metric tons ⚙️ |
| average speed | 42 km/h ⚙️ |
2019 monitoring methods:
N/A
2019 Theoretical
EIV (Efficiency Indicator Values): 20.55 gCO₂/ton/nautical mile
﹖ details
| 2018 yearly CO₂ Emissions | |||
|---|---|---|---|
| assigned to | total | average | ratio |
| persons 🙎♀️ | 1260 tonnes CO₂ | 17 g·CO₂/pax/n.mile | 1 % ⚙️ |
| freight 🚛 | 103878 tonnes CO₂ | 208 kg·CO₂/m tonne/n.mile | 99 % ⚙️ |
| total | 105138 tonnes CO₂ | 762 kg·CO₂/n.mile | 100% |
| 2018 yearly statistics | |
|---|---|
| distance travelled | 255686 km ⚙️ |
| time at sea | 6101 hours |
| 2018 average statistics per journey | |
|---|---|
| average persons transported 🙎♀️ | 536 persons ⚙️ |
| average freight transported 🚛 | 3618 metric tons ⚙️ |
| average speed | 42 km/h ⚙️ |
2018 monitoring methods:
N/A
2018 Theoretical
EIV (Efficiency Indicator Values): 20.55 gCO₂/ton/nautical mile
﹖ details
ℹ️
Figures with the icon ⚙️ were computed based on the published data.
You can find computation details on
this page ↗
GreenFerries is a hobby project, all the data shown here has no official value. It is Open Source, so you can double check and modify it.

The Ecoscore compares
average CO₂ emissions per passenger per km.
‟emits like 2.1 planes” means that the ferry emits more than twice what an average plane would on the same distance for one passenger.