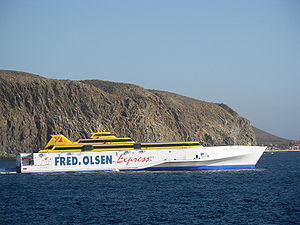
HSC Benchijigua Express

over 4 times an average plane's emissions
(based on 2022 data)
Often travels on 0 routes
⚠️
Do you know of a route that this ship frequently travels but is not listed? Or have you noticed an error?
Please help by letting us know, thank you 🙇🏽♀️
Please help by letting us know, thank you 🙇🏽♀️
Ship Statistics
| 2022 yearly CO₂ Emissions | |||
|---|---|---|---|
| assigned to | total | average | ratio |
| persons 🙎♀️ | 27008 tonnes CO₂ | 1122 g·CO₂/pax/n.mile | 62 % ⚙️ |
| freight 🚛 | 16371 tonnes CO₂ | 681 kg·CO₂/m tonne/n.mile | 38 % ⚙️ |
| total | 43379 tonnes CO₂ | 522 kg·CO₂/n.mile | 100% |
| 2022 yearly statistics | |
|---|---|
| distance travelled | 153941 km ⚙️ |
| time at sea | 3668 hours |
| 2022 average statistics per journey | |
|---|---|
| average persons transported 🙎♀️ | 290 persons ⚙️ |
| average freight transported 🚛 | 289 metric tons ⚙️ |
| average speed | 42 km/h ⚙️ |
2022 monitoring methods:
N/A
2022 Theoretical
N/A
﹖ details
| 2021 yearly CO₂ Emissions | |||
|---|---|---|---|
| assigned to | total | average | ratio |
| persons 🙎♀️ | 27001 tonnes CO₂ | 1036 g·CO₂/pax/n.mile | 60 % ⚙️ |
| freight 🚛 | 18197 tonnes CO₂ | 678 kg·CO₂/m tonne/n.mile | 40 % ⚙️ |
| total | 45198 tonnes CO₂ | 542 kg·CO₂/n.mile | 100% |
| 2021 yearly statistics | |
|---|---|
| distance travelled | 154488 km ⚙️ |
| time at sea | 3175 hours |
| 2021 average statistics per journey | |
|---|---|
| average persons transported 🙎♀️ | 312 persons ⚙️ |
| average freight transported 🚛 | 322 metric tons ⚙️ |
| average speed | 49 km/h ⚙️ |
2021 monitoring methods:
N/A
2021 Theoretical
N/A
﹖ details
| 2020 yearly CO₂ Emissions | |||
|---|---|---|---|
| assigned to | total | average | ratio |
| persons 🙎♀️ | 19735 tonnes CO₂ | 1092 g·CO₂/pax/n.mile | 48 % ⚙️ |
| freight 🚛 | 21380 tonnes CO₂ | 920 kg·CO₂/m tonne/n.mile | 52 % ⚙️ |
| total | 41114 tonnes CO₂ | 552 kg·CO₂/n.mile | 100% |
| 2020 yearly statistics | |
|---|---|
| distance travelled | 137830 km ⚙️ |
| time at sea | 2847 hours |
| 2020 average statistics per journey | |
|---|---|
| average persons transported 🙎♀️ | 243 persons ⚙️ |
| average freight transported 🚛 | 312 metric tons ⚙️ |
| average speed | 48 km/h ⚙️ |
2020 monitoring methods:
N/A
2020 Theoretical
N/A
﹖ details
| 2019 yearly CO₂ Emissions | |||
|---|---|---|---|
| assigned to | total | average | ratio |
| persons 🙎♀️ | 27851 tonnes CO₂ | 850 g·CO₂/pax/n.mile | 53 % ⚙️ |
| freight 🚛 | 24698 tonnes CO₂ | 818 kg·CO₂/m tonne/n.mile | 47 % ⚙️ |
| total | 52550 tonnes CO₂ | 579 kg·CO₂/n.mile | 100% |
| 2019 yearly statistics | |
|---|---|
| distance travelled | 168232 km ⚙️ |
| time at sea | 3912 hours |
| 2019 average statistics per journey | |
|---|---|
| average persons transported 🙎♀️ | 361 persons ⚙️ |
| average freight transported 🚛 | 332 metric tons ⚙️ |
| average speed | 43 km/h ⚙️ |
2019 monitoring methods:
N/A
2019 Theoretical
N/A
﹖ details
| 2018 yearly CO₂ Emissions | |||
|---|---|---|---|
| assigned to | total | average | ratio |
| persons 🙎♀️ | 51354 tonnes CO₂ | 2397 g·CO₂/pax/n.mile | 100 % ⚙️ |
| freight 🚛 | N/A | N/A | N/A |
| total | 51354 tonnes CO₂ | 565 kg·CO₂/n.mile | 100% |
| 2018 yearly statistics | |
|---|---|
| distance travelled | 168446 km ⚙️ |
| time at sea | 3776 hours |
| 2018 average statistics per journey | |
|---|---|
| average persons transported 🙎♀️ | 236 persons ⚙️ |
| average freight transported 🚛 | N/A |
| average speed | 45 km/h ⚙️ |
2018 monitoring methods:
N/A
2018 Theoretical
EIV (Efficiency Indicator Values): 37.8 gCO₂/ton/nautical mile
﹖ details
ℹ️
Figures with the icon ⚙️ were computed based on the published data.
You can find computation details on
this page ↗
GreenFerries is a hobby project, all the data shown here has no official value. It is Open Source, so you can double check and modify it.

The Ecoscore compares
average CO₂ emissions per passenger per km.
‟emits like 2.1 planes” means that the ferry emits more than twice what an average plane would on the same distance for one passenger.