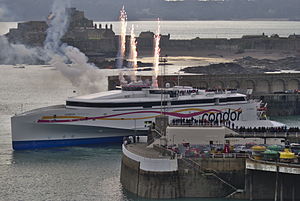
HSC Condor Liberation

over 4 times an average plane's emissions
(based on 2022 data)
Often travels on 2 routes
⚠️
Do you know of a route that this ship frequently travels but is not listed? Or have you noticed an error?
Please help by letting us know, thank you 🙇🏽♀️
Please help by letting us know, thank you 🙇🏽♀️
Ship Statistics
| 2022 yearly CO₂ Emissions | |||
|---|---|---|---|
| assigned to | total | average | ratio |
| persons 🙎♀️ | 4859 tonnes CO₂ | 1713 g·CO₂/pax/n.mile | 95 % ⚙️ |
| freight 🚛 | 256 tonnes CO₂ | 140 kg·CO₂/m tonne/n.mile | 5 % ⚙️ |
| total | 5115 tonnes CO₂ | 449 kg·CO₂/n.mile | 100% |
| 2022 yearly statistics | |
|---|---|
| distance travelled | 21118 km ⚙️ |
| time at sea | 497 hours |
| 2022 average statistics per journey | |
|---|---|
| average persons transported 🙎♀️ | 249 persons ⚙️ |
| average freight transported 🚛 | 161 metric tons ⚙️ |
| average speed | 43 km/h ⚙️ |
2022 monitoring methods:
N/A
2022 Theoretical
EIV (Efficiency Indicator Values): 13.47 gCO₂/ton/nautical mile
﹖ details
| 2021 yearly CO₂ Emissions | |||
|---|---|---|---|
| assigned to | total | average | ratio |
| persons 🙎♀️ | 29 tonnes CO₂ | 5673 g·CO₂/pax/n.mile | 95 % ⚙️ |
| freight 🚛 | 2 tonnes CO₂ | 316 kg·CO₂/m tonne/n.mile | 5 % ⚙️ |
| total | 30 tonnes CO₂ | 447 kg·CO₂/n.mile | 100% |
| 2021 yearly statistics | |
|---|---|
| distance travelled | 126 km ⚙️ |
| time at sea | 3 hours |
| 2021 average statistics per journey | |
|---|---|
| average persons transported 🙎♀️ | 75 persons ⚙️ |
| average freight transported 🚛 | 71 metric tons ⚙️ |
| average speed | 44 km/h ⚙️ |
2021 monitoring methods:
N/A
2021 Theoretical
EIV (Efficiency Indicator Values): 13.47 gCO₂/ton/nautical mile
﹖ details
| 2020 yearly CO₂ Emissions | |||
|---|---|---|---|
| assigned to | total | average | ratio |
| persons 🙎♀️ | 6627 tonnes CO₂ | 1888 g·CO₂/pax/n.mile | 95 % ⚙️ |
| freight 🚛 | 349 tonnes CO₂ | 119 kg·CO₂/m tonne/n.mile | 5 % ⚙️ |
| total | 6975 tonnes CO₂ | 525 kg·CO₂/n.mile | 100% |
| 2020 yearly statistics | |
|---|---|
| distance travelled | 24625 km ⚙️ |
| time at sea | 1655 hours |
| 2020 average statistics per journey | |
|---|---|
| average persons transported 🙎♀️ | 264 persons ⚙️ |
| average freight transported 🚛 | 220 metric tons ⚙️ |
| average speed | 15 km/h ⚙️ |
2020 monitoring methods:
N/A
2020 Theoretical
EIV (Efficiency Indicator Values): 13.47 gCO₂/ton/nautical mile
﹖ details
| 2019 yearly CO₂ Emissions | |||
|---|---|---|---|
| assigned to | total | average | ratio |
| persons 🙎♀️ | 19881 tonnes CO₂ | 1230 g·CO₂/pax/n.mile | 99 % ⚙️ |
| freight 🚛 | 201 tonnes CO₂ | 18 kg·CO₂/m tonne/n.mile | 1 % ⚙️ |
| total | 20082 tonnes CO₂ | 495 kg·CO₂/n.mile | 100% |
| 2019 yearly statistics | |
|---|---|
| distance travelled | 75156 km ⚙️ |
| time at sea | 1648 hours |
| 2019 average statistics per journey | |
|---|---|
| average persons transported 🙎♀️ | 398 persons ⚙️ |
| average freight transported 🚛 | 269 metric tons ⚙️ |
| average speed | 46 km/h ⚙️ |
2019 monitoring methods:
N/A
2019 Theoretical
EIV (Efficiency Indicator Values): 13.47 gCO₂/ton/nautical mile
﹖ details
| 2018 yearly CO₂ Emissions | |||
|---|---|---|---|
| assigned to | total | average | ratio |
| persons 🙎♀️ | 41777 tonnes CO₂ | 2337 g·CO₂/pax/n.mile | 99 % ⚙️ |
| freight 🚛 | 422 tonnes CO₂ | 37 kg·CO₂/m tonne/n.mile | 0.9999571077952241 % ⚙️ |
| total | 42199 tonnes CO₂ | 1033 kg·CO₂/n.mile | 100% |
| 2018 yearly statistics | |
|---|---|
| distance travelled | 75645 km ⚙️ |
| time at sea | 1497 hours |
| 2018 average statistics per journey | |
|---|---|
| average persons transported 🙎♀️ | 438 persons ⚙️ |
| average freight transported 🚛 | 277 metric tons ⚙️ |
| average speed | 51 km/h ⚙️ |
2018 monitoring methods:
N/A
2018 Theoretical
N/A
﹖ details
ℹ️
Figures with the icon ⚙️ were computed based on the published data.
You can find computation details on
this page ↗
GreenFerries is a hobby project, all the data shown here has no official value. It is Open Source, so you can double check and modify it.

The Ecoscore compares
average CO₂ emissions per passenger per km.
‟emits like 2.1 planes” means that the ferry emits more than twice what an average plane would on the same distance for one passenger.