HSC Condor Rapide
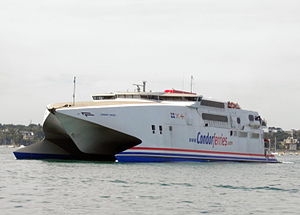

over 4 times an average plane's emissions
(based on 2020 data)
Often travels on 1 routes
- Guernesey [GG] ↔ Saint-Malo [FR] - 98 km
⚠️
Do you know of a route that this ship frequently travels but is not listed? Or have you noticed an error?
Please help by letting us know, thank you 🙇🏽♀️
Please help by letting us know, thank you 🙇🏽♀️
Ship Statistics
| 2022 yearly CO₂ Emissions | |||
|---|---|---|---|
| assigned to | total | average | ratio |
| persons 🙎♀️ | N/A | N/A | N/A |
| freight 🚛 | N/A | N/A | N/A |
| total | N/A | N/A | 100% |
| 2022 yearly statistics | |
|---|---|
| distance travelled | N/A |
| time at sea | N/A |
| 2022 average statistics per journey | |
|---|---|
| average persons transported 🙎♀️ | N/A |
| average freight transported 🚛 | N/A |
| average speed | N/A |
2022 monitoring methods:
N/A
2022 Theoretical
N/A
﹖ details
| 2021 yearly CO₂ Emissions | |||
|---|---|---|---|
| assigned to | total | average | ratio |
| persons 🙎♀️ | N/A | N/A | N/A |
| freight 🚛 | N/A | N/A | N/A |
| total | N/A | N/A | 100% |
| 2021 yearly statistics | |
|---|---|
| distance travelled | N/A |
| time at sea | N/A |
| 2021 average statistics per journey | |
|---|---|
| average persons transported 🙎♀️ | N/A |
| average freight transported 🚛 | N/A |
| average speed | N/A |
2021 monitoring methods:
N/A
2021 Theoretical
N/A
﹖ details
| 2020 yearly CO₂ Emissions | |||
|---|---|---|---|
| assigned to | total | average | ratio |
| persons 🙎♀️ | 4509 tonnes CO₂ | 3079 g·CO₂/pax/n.mile | 99 % ⚙️ |
| freight 🚛 | 46 tonnes CO₂ | 45 kg·CO₂/m tonne/n.mile | 0.9997035800937693 % ⚙️ |
| total | 4554 tonnes CO₂ | 441 kg·CO₂/n.mile | 100% |
| 2020 yearly statistics | |
|---|---|
| distance travelled | 19137 km ⚙️ |
| time at sea | 525 hours |
| 2020 average statistics per journey | |
|---|---|
| average persons transported 🙎♀️ | 142 persons ⚙️ |
| average freight transported 🚛 | 98 metric tons ⚙️ |
| average speed | 36 km/h ⚙️ |
2020 monitoring methods:
N/A
2020 Theoretical
EIV (Efficiency Indicator Values): 16.27 gCO₂/ton/nautical mile
﹖ details
| 2019 yearly CO₂ Emissions | |||
|---|---|---|---|
| assigned to | total | average | ratio |
| persons 🙎♀️ | 18699 tonnes CO₂ | 1140 g·CO₂/pax/n.mile | 99 % ⚙️ |
| freight 🚛 | 189 tonnes CO₂ | 31 kg·CO₂/m tonne/n.mile | 0.9999491739711375 % ⚙️ |
| total | 18888 tonnes CO₂ | 416 kg·CO₂/n.mile | 100% |
| 2019 yearly statistics | |
|---|---|
| distance travelled | 84005 km ⚙️ |
| time at sea | 1751 hours |
| 2019 average statistics per journey | |
|---|---|
| average persons transported 🙎♀️ | 361 persons ⚙️ |
| average freight transported 🚛 | 135 metric tons ⚙️ |
| average speed | 48 km/h ⚙️ |
2019 monitoring methods:
N/A
2019 Theoretical
EIV (Efficiency Indicator Values): 16.27 gCO₂/ton/nautical mile
﹖ details
| 2018 yearly CO₂ Emissions | |||
|---|---|---|---|
| assigned to | total | average | ratio |
| persons 🙎♀️ | 32522 tonnes CO₂ | 1967 g·CO₂/pax/n.mile | 99 % ⚙️ |
| freight 🚛 | 328 tonnes CO₂ | 54 kg·CO₂/m tonne/n.mile | 0.9999601221419185 % ⚙️ |
| total | 32850 tonnes CO₂ | 742 kg·CO₂/n.mile | 100% |
| 2018 yearly statistics | |
|---|---|
| distance travelled | 82013 km ⚙️ |
| time at sea | 1718 hours |
| 2018 average statistics per journey | |
|---|---|
| average persons transported 🙎♀️ | 373 persons ⚙️ |
| average freight transported 🚛 | 137 metric tons ⚙️ |
| average speed | 48 km/h ⚙️ |
2018 monitoring methods:
N/A
2018 Theoretical
EIV (Efficiency Indicator Values): 16.27 gCO₂/ton/nautical mile
﹖ details
ℹ️
Figures with the icon ⚙️ were computed based on the published data.
You can find computation details on
this page ↗
GreenFerries is a hobby project, all the data shown here has no official value. It is Open Source, so you can double check and modify it.

The Ecoscore compares
average CO₂ emissions per passenger per km.
‟emits like 2.1 planes” means that the ferry emits more than twice what an average plane would on the same distance for one passenger.