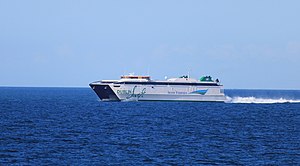
HSC Dublin Swift

better than riding a car with a single passenger
(based on 2022 data)
Often travels on 1 routes
- Dublin [IE] ↔ Holyhead [GB] - 107 km
⚠️
Do you know of a route that this ship frequently travels but is not listed? Or have you noticed an error?
Please help by letting us know, thank you 🙇🏽♀️
Please help by letting us know, thank you 🙇🏽♀️
Ship Statistics
| 2022 yearly CO₂ Emissions | |||
|---|---|---|---|
| assigned to | total | average | ratio |
| persons 🙎♀️ | 2643 tonnes CO₂ | 260 g·CO₂/pax/n.mile | 11 % ⚙️ |
| freight 🚛 | 21386 tonnes CO₂ | 3214 kg·CO₂/m tonne/n.mile | 89 % ⚙️ |
| total | 24030 tonnes CO₂ | 554 kg·CO₂/n.mile | 100% |
| 2022 yearly statistics | |
|---|---|
| distance travelled | 80318 km ⚙️ |
| time at sea | 1792 hours |
| 2022 average statistics per journey | |
|---|---|
| average persons transported 🙎♀️ | 235 persons ⚙️ |
| average freight transported 🚛 | 153 metric tons ⚙️ |
| average speed | 45 km/h ⚙️ |
2022 monitoring methods:
N/A
2022 Theoretical
EIV (Efficiency Indicator Values): 18.25 gCO₂/ton/nautical mile
﹖ details
| 2021 yearly CO₂ Emissions | |||
|---|---|---|---|
| assigned to | total | average | ratio |
| persons 🙎♀️ | 3641 tonnes CO₂ | 1210 g·CO₂/pax/n.mile | 50 % ⚙️ |
| freight 🚛 | 3641 tonnes CO₂ | 1523 kg·CO₂/m tonne/n.mile | 50 % ⚙️ |
| total | 7282 tonnes CO₂ | 559 kg·CO₂/n.mile | 100% |
| 2021 yearly statistics | |
|---|---|
| distance travelled | 24126 km ⚙️ |
| time at sea | 6265 hours |
| 2021 average statistics per journey | |
|---|---|
| average persons transported 🙎♀️ | 231 persons ⚙️ |
| average freight transported 🚛 | 184 metric tons ⚙️ |
| average speed | 4 km/h ⚙️ |
2021 monitoring methods:
N/A
2021 Theoretical
EIV (Efficiency Indicator Values): 18.25 gCO₂/ton/nautical mile
﹖ details
| 2020 yearly CO₂ Emissions | |||
|---|---|---|---|
| assigned to | total | average | ratio |
| persons 🙎♀️ | N/A | N/A | N/A |
| freight 🚛 | N/A | N/A | N/A |
| total | N/A | N/A | 100% |
| 2020 yearly statistics | |
|---|---|
| distance travelled | N/A |
| time at sea | N/A |
| 2020 average statistics per journey | |
|---|---|
| average persons transported 🙎♀️ | N/A |
| average freight transported 🚛 | N/A |
| average speed | N/A |
2020 monitoring methods:
N/A
2020 Theoretical
N/A
﹖ details
| 2019 yearly CO₂ Emissions | |||
|---|---|---|---|
| assigned to | total | average | ratio |
| persons 🙎♀️ | 14918 tonnes CO₂ | 3 g·CO₂/pax/n.mile | 100 % ⚙️ |
| freight 🚛 | 14918 tonnes CO₂ | 5 kg·CO₂/m tonne/n.mile | N/A |
| total | 14918 tonnes CO₂ | 526 kg·CO₂/n.mile | 100% |
| 2019 yearly statistics | |
|---|---|
| distance travelled | 52503 km ⚙️ |
| time at sea | 1122 hours |
| 2019 average statistics per journey | |
|---|---|
| average persons transported 🙎♀️ | 161423 persons ⚙️ |
| average freight transported 🚛 | 97092 metric tons ⚙️ |
| average speed | 47 km/h ⚙️ |
2019 monitoring methods:
N/A
2019 Theoretical
EIV (Efficiency Indicator Values): 637.5 gCO₂/ton/nautical mile
﹖ details
| 2018 yearly CO₂ Emissions | |||
|---|---|---|---|
| assigned to | total | average | ratio |
| persons 🙎♀️ | 16499 tonnes CO₂ | 3 g·CO₂/pax/n.mile | 100 % ⚙️ |
| freight 🚛 | 16499 tonnes CO₂ | 6 kg·CO₂/m tonne/n.mile | N/A |
| total | 16499 tonnes CO₂ | 568 kg·CO₂/n.mile | 100% |
| 2018 yearly statistics | |
|---|---|
| distance travelled | 53781 km ⚙️ |
| time at sea | 1123 hours |
| 2018 average statistics per journey | |
|---|---|
| average persons transported 🙎♀️ | 194572 persons ⚙️ |
| average freight transported 🚛 | 101819 metric tons ⚙️ |
| average speed | 48 km/h ⚙️ |
2018 monitoring methods:
N/A
2018 Theoretical
EIV (Efficiency Indicator Values): 637.5 gCO₂/ton/nautical mile
﹖ details
ℹ️
Figures with the icon ⚙️ were computed based on the published data.
You can find computation details on
this page ↗
GreenFerries is a hobby project, all the data shown here has no official value. It is Open Source, so you can double check and modify it.

The Ecoscore compares
average CO₂ emissions per passenger per km.
‟emits like 2.1 planes” means that the ferry emits more than twice what an average plane would on the same distance for one passenger.