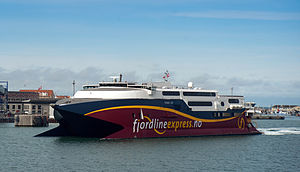
HSC Fjord Cat

1 to 2 times an average plane's emissions
(based on 2022 data)
Often travels on 1 routes
- Hirtshals [DK] ↔ Kristiansand [NO] - 131 km
⚠️
Do you know of a route that this ship frequently travels but is not listed? Or have you noticed an error?
Please help by letting us know, thank you 🙇🏽♀️
Please help by letting us know, thank you 🙇🏽♀️
Ship Statistics
| 2022 yearly CO₂ Emissions | |||
|---|---|---|---|
| assigned to | total | average | ratio |
| persons 🙎♀️ | 3759 tonnes CO₂ | 374 g·CO₂/pax/n.mile | 25 % ⚙️ |
| freight 🚛 | 11278 tonnes CO₂ | 2577 kg·CO₂/m tonne/n.mile | 75 % ⚙️ |
| total | 15038 tonnes CO₂ | 358 kg·CO₂/n.mile | 100% |
| 2022 yearly statistics | |
|---|---|
| distance travelled | 77876 km ⚙️ |
| time at sea | 1672 hours |
| 2022 average statistics per journey | |
|---|---|
| average persons transported 🙎♀️ | 239 persons ⚙️ |
| average freight transported 🚛 | 104 metric tons ⚙️ |
| average speed | 47 km/h ⚙️ |
2022 monitoring methods:
N/A
2022 Theoretical
EIV (Efficiency Indicator Values): 13.53 gCO₂/ton/nautical mile
﹖ details
| 2021 yearly CO₂ Emissions | |||
|---|---|---|---|
| assigned to | total | average | ratio |
| persons 🙎♀️ | 2709 tonnes CO₂ | 393 g·CO₂/pax/n.mile | 25 % ⚙️ |
| freight 🚛 | 8127 tonnes CO₂ | 2229 kg·CO₂/m tonne/n.mile | 75 % ⚙️ |
| total | 10835 tonnes CO₂ | 359 kg·CO₂/n.mile | 100% |
| 2021 yearly statistics | |
|---|---|
| distance travelled | 55896 km ⚙️ |
| time at sea | 1163 hours |
| 2021 average statistics per journey | |
|---|---|
| average persons transported 🙎♀️ | 229 persons ⚙️ |
| average freight transported 🚛 | 121 metric tons ⚙️ |
| average speed | 48 km/h ⚙️ |
2021 monitoring methods:
N/A
2021 Theoretical
EIV (Efficiency Indicator Values): 13.53 gCO₂/ton/nautical mile
﹖ details
| 2020 yearly CO₂ Emissions | |||
|---|---|---|---|
| assigned to | total | average | ratio |
| persons 🙎♀️ | 2660 tonnes CO₂ | 395 g·CO₂/pax/n.mile | 30 % ⚙️ |
| freight 🚛 | 6206 tonnes CO₂ | 8996 kg·CO₂/m tonne/n.mile | 70 % ⚙️ |
| total | 8866 tonnes CO₂ | 433 kg·CO₂/n.mile | 100% |
| 2020 yearly statistics | |
|---|---|
| distance travelled | 37908 km ⚙️ |
| time at sea | 902 hours |
| 2020 average statistics per journey | |
|---|---|
| average persons transported 🙎♀️ | 329 persons ⚙️ |
| average freight transported 🚛 | 34 metric tons ⚙️ |
| average speed | 42 km/h ⚙️ |
2020 monitoring methods:
N/A
2020 Theoretical
EIV (Efficiency Indicator Values): 13.53 gCO₂/ton/nautical mile
﹖ details
| 2019 yearly CO₂ Emissions | |||
|---|---|---|---|
| assigned to | total | average | ratio |
| persons 🙎♀️ | 19829 tonnes CO₂ | 1188 g·CO₂/pax/n.mile | 97 % ⚙️ |
| freight 🚛 | 3 tonnes CO₂ | 2468 kg·CO₂/m tonne/n.mile | 3 % ⚙️ |
| total | 20352 tonnes CO₂ | 430 kg·CO₂/n.mile | 100% |
| 2019 yearly statistics | |
|---|---|
| distance travelled | 87695 km ⚙️ |
| time at sea | 1780 hours |
| 2019 average statistics per journey | |
|---|---|
| average persons transported 🙎♀️ | 353 persons ⚙️ |
| average freight transported 🚛 | 0.027467365779750806 metric tons ⚙️ |
| average speed | 49 km/h ⚙️ |
2019 monitoring methods:
N/A
2019 Theoretical
EIV (Efficiency Indicator Values): 9 gCO₂/ton/nautical mile
﹖ details
| 2018 yearly CO₂ Emissions | |||
|---|---|---|---|
| assigned to | total | average | ratio |
| persons 🙎♀️ | 17880 tonnes CO₂ | 1180 g·CO₂/pax/n.mile | 98 % ⚙️ |
| freight 🚛 | 3 tonnes CO₂ | 3255 kg·CO₂/m tonne/n.mile | 2 % ⚙️ |
| total | 18258 tonnes CO₂ | 439 kg·CO₂/n.mile | 100% |
| 2018 yearly statistics | |
|---|---|
| distance travelled | 76968 km ⚙️ |
| time at sea | 1531 hours |
| 2018 average statistics per journey | |
|---|---|
| average persons transported 🙎♀️ | 365 persons ⚙️ |
| average freight transported 🚛 | 0.02373076127363887 metric tons ⚙️ |
| average speed | 50 km/h ⚙️ |
2018 monitoring methods:
N/A
2018 Theoretical
EIV (Efficiency Indicator Values): 9 gCO₂/ton/nautical mile
﹖ details
ℹ️
Figures with the icon ⚙️ were computed based on the published data.
You can find computation details on
this page ↗
GreenFerries is a hobby project, all the data shown here has no official value. It is Open Source, so you can double check and modify it.

The Ecoscore compares
average CO₂ emissions per passenger per km.
‟emits like 2.1 planes” means that the ferry emits more than twice what an average plane would on the same distance for one passenger.