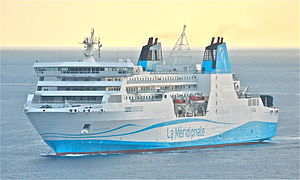
Kalliste

2 to 4 times an average plane's emissions
(based on 2022 data)
Often travels on 1 routes
- Marseille [FR] ↔ Propriano [FR] - 342 km
⚠️
Do you know of a route that this ship frequently travels but is not listed? Or have you noticed an error?
Please help by letting us know, thank you 🙇🏽♀️
Please help by letting us know, thank you 🙇🏽♀️
Ship Statistics
| 2022 yearly CO₂ Emissions | |||
|---|---|---|---|
| assigned to | total | average | ratio |
| persons 🙎♀️ | 11423 tonnes CO₂ | 828 g·CO₂/pax/n.mile | 40 % ⚙️ |
| freight 🚛 | 17299 tonnes CO₂ | 858 kg·CO₂/m tonne/n.mile | 60 % ⚙️ |
| total | 28722 tonnes CO₂ | 472 kg·CO₂/n.mile | 100% |
| 2022 yearly statistics | |
|---|---|
| distance travelled | 112784 km ⚙️ |
| time at sea | 4037 hours |
| 2022 average statistics per journey | |
|---|---|
| average persons transported 🙎♀️ | 227 persons ⚙️ |
| average freight transported 🚛 | 331 metric tons ⚙️ |
| average speed | 28 km/h ⚙️ |
2022 monitoring methods:
N/A
2022 Theoretical
EIV (Efficiency Indicator Values): 13.73 gCO₂/ton/nautical mile
﹖ details
| 2021 yearly CO₂ Emissions | |||
|---|---|---|---|
| assigned to | total | average | ratio |
| persons 🙎♀️ | 11574 tonnes CO₂ | 956 g·CO₂/pax/n.mile | 45 % ⚙️ |
| freight 🚛 | 16549 tonnes CO₂ | 751 kg·CO₂/m tonne/n.mile | 55 % ⚙️ |
| total | 25981 tonnes CO₂ | 480 kg·CO₂/n.mile | 100% |
| 2021 yearly statistics | |
|---|---|
| distance travelled | 100305 km ⚙️ |
| time at sea | 3611 hours |
| 2021 average statistics per journey | |
|---|---|
| average persons transported 🙎♀️ | 224 persons ⚙️ |
| average freight transported 🚛 | 407 metric tons ⚙️ |
| average speed | 28 km/h ⚙️ |
2021 monitoring methods:
N/A
2021 Theoretical
EIV (Efficiency Indicator Values): 13.73 gCO₂/ton/nautical mile
﹖ details
| 2020 yearly CO₂ Emissions | |||
|---|---|---|---|
| assigned to | total | average | ratio |
| persons 🙎♀️ | 7096 tonnes CO₂ | 821 g·CO₂/pax/n.mile | 29 % ⚙️ |
| freight 🚛 | 14900 tonnes CO₂ | 898 kg·CO₂/m tonne/n.mile | 71 % ⚙️ |
| total | 24513 tonnes CO₂ | 453 kg·CO₂/n.mile | 100% |
| 2020 yearly statistics | |
|---|---|
| distance travelled | 100284 km ⚙️ |
| time at sea | 3538 hours |
| 2020 average statistics per journey | |
|---|---|
| average persons transported 🙎♀️ | 160 persons ⚙️ |
| average freight transported 🚛 | 306 metric tons ⚙️ |
| average speed | 28 km/h ⚙️ |
2020 monitoring methods:
N/A
2020 Theoretical
EIV (Efficiency Indicator Values): 13.73 gCO₂/ton/nautical mile
﹖ details
| 2019 yearly CO₂ Emissions | |||
|---|---|---|---|
| assigned to | total | average | ratio |
| persons 🙎♀️ | 7821 tonnes CO₂ | 642 g·CO₂/pax/n.mile | 26 % ⚙️ |
| freight 🚛 | 19751 tonnes CO₂ | 716 kg·CO₂/m tonne/n.mile | 74 % ⚙️ |
| total | 30012 tonnes CO₂ | 493 kg·CO₂/n.mile | 100% |
| 2019 yearly statistics | |
|---|---|
| distance travelled | 112823 km ⚙️ |
| time at sea | 3860 hours |
| 2019 average statistics per journey | |
|---|---|
| average persons transported 🙎♀️ | 200 persons ⚙️ |
| average freight transported 🚛 | 453 metric tons ⚙️ |
| average speed | 29 km/h ⚙️ |
2019 monitoring methods:
N/A
2019 Theoretical
EIV (Efficiency Indicator Values): 9.68 gCO₂/ton/nautical mile
﹖ details
| 2018 yearly CO₂ Emissions | |||
|---|---|---|---|
| assigned to | total | average | ratio |
| persons 🙎♀️ | 3918 tonnes CO₂ | 265 g·CO₂/pax/n.mile | 11 % ⚙️ |
| freight 🚛 | 28467 tonnes CO₂ | 696 kg·CO₂/m tonne/n.mile | 89 % ⚙️ |
| total | 34644 tonnes CO₂ | 496 kg·CO₂/n.mile | 100% |
| 2018 yearly statistics | |
|---|---|
| distance travelled | 129473 km ⚙️ |
| time at sea | 4420 hours |
| 2018 average statistics per journey | |
|---|---|
| average persons transported 🙎♀️ | 211 persons ⚙️ |
| average freight transported 🚛 | 585 metric tons ⚙️ |
| average speed | 29 km/h ⚙️ |
2018 monitoring methods:
N/A
2018 Theoretical
EIV (Efficiency Indicator Values): 30.56 gCO₂/ton/nautical mile
﹖ details
ℹ️
Figures with the icon ⚙️ were computed based on the published data.
You can find computation details on
this page ↗
GreenFerries is a hobby project, all the data shown here has no official value. It is Open Source, so you can double check and modify it.

The Ecoscore compares
average CO₂ emissions per passenger per km.
‟emits like 2.1 planes” means that the ferry emits more than twice what an average plane would on the same distance for one passenger.