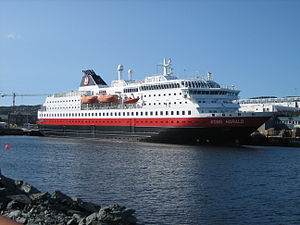
Kong Harald

2 to 4 times an average plane's emissions
(based on 2022 data)
Often travels on 0 routes
⚠️
Do you know of a route that this ship frequently travels but is not listed? Or have you noticed an error?
Please help by letting us know, thank you 🙇🏽♀️
Please help by letting us know, thank you 🙇🏽♀️
Ship Statistics
| 2022 yearly CO₂ Emissions | |||
|---|---|---|---|
| assigned to | total | average | ratio |
| persons 🙎♀️ | 13515 tonnes CO₂ | 806 g·CO₂/pax/n.mile | 89 % ⚙️ |
| freight 🚛 | 1670 tonnes CO₂ | 535 kg·CO₂/m tonne/n.mile | 11 % ⚙️ |
| total | 15185 tonnes CO₂ | 252 kg·CO₂/n.mile | 100% |
| 2022 yearly statistics | |
|---|---|
| distance travelled | 111694 km ⚙️ |
| time at sea | 4707 hours |
| 2022 average statistics per journey | |
|---|---|
| average persons transported 🙎♀️ | 278 persons ⚙️ |
| average freight transported 🚛 | 52 metric tons ⚙️ |
| average speed | 24 km/h ⚙️ |
2022 monitoring methods:
N/A
2022 Theoretical
EIV (Efficiency Indicator Values): 59.1 gCO₂/ton/nautical mile
﹖ details
| 2021 yearly CO₂ Emissions | |||
|---|---|---|---|
| assigned to | total | average | ratio |
| persons 🙎♀️ | 17060 tonnes CO₂ | 1466 g·CO₂/pax/n.mile | 89 % ⚙️ |
| freight 🚛 | 2109 tonnes CO₂ | 395 kg·CO₂/m tonne/n.mile | 11 % ⚙️ |
| total | 19168 tonnes CO₂ | 217 kg·CO₂/n.mile | 100% |
| 2021 yearly statistics | |
|---|---|
| distance travelled | 163911 km ⚙️ |
| time at sea | 6976 hours |
| 2021 average statistics per journey | |
|---|---|
| average persons transported 🙎♀️ | 131 persons ⚙️ |
| average freight transported 🚛 | 60 metric tons ⚙️ |
| average speed | 23 km/h ⚙️ |
2021 monitoring methods:
N/A
2021 Theoretical
EIV (Efficiency Indicator Values): 59.1 gCO₂/ton/nautical mile
﹖ details
| 2020 yearly CO₂ Emissions | |||
|---|---|---|---|
| assigned to | total | average | ratio |
| persons 🙎♀️ | 8338 tonnes CO₂ | 1272 g·CO₂/pax/n.mile | 89 % ⚙️ |
| freight 🚛 | 1031 tonnes CO₂ | 525 kg·CO₂/m tonne/n.mile | 11 % ⚙️ |
| total | 9369 tonnes CO₂ | 237 kg·CO₂/n.mile | 100% |
| 2020 yearly statistics | |
|---|---|
| distance travelled | 73119 km ⚙️ |
| time at sea | 3274 hours |
| 2020 average statistics per journey | |
|---|---|
| average persons transported 🙎♀️ | 166 persons ⚙️ |
| average freight transported 🚛 | 50 metric tons ⚙️ |
| average speed | 22 km/h ⚙️ |
2020 monitoring methods:
N/A
2020 Theoretical
EIV (Efficiency Indicator Values): 59.1 gCO₂/ton/nautical mile
﹖ details
| 2019 yearly CO₂ Emissions | |||
|---|---|---|---|
| assigned to | total | average | ratio |
| persons 🙎♀️ | 19092 tonnes CO₂ | 605 g·CO₂/pax/n.mile | 89 % ⚙️ |
| freight 🚛 | 2360 tonnes CO₂ | 308 kg·CO₂/m tonne/n.mile | 11 % ⚙️ |
| total | 21451 tonnes CO₂ | 240 kg·CO₂/n.mile | 100% |
| 2019 yearly statistics | |
|---|---|
| distance travelled | 165291 km ⚙️ |
| time at sea | 6740 hours |
| 2019 average statistics per journey | |
|---|---|
| average persons transported 🙎♀️ | 353 persons ⚙️ |
| average freight transported 🚛 | 86 metric tons ⚙️ |
| average speed | 25 km/h ⚙️ |
2019 monitoring methods:
N/A
2019 Theoretical
EIV (Efficiency Indicator Values): 88.3 gCO₂/ton/nautical mile
﹖ details
| 2018 yearly CO₂ Emissions | |||
|---|---|---|---|
| assigned to | total | average | ratio |
| persons 🙎♀️ | 19522 tonnes CO₂ | 638 g·CO₂/pax/n.mile | 89 % ⚙️ |
| freight 🚛 | 2413 tonnes CO₂ | 962 kg·CO₂/m tonne/n.mile | 11 % ⚙️ |
| total | 21935 tonnes CO₂ | 249 kg·CO₂/n.mile | 100% |
| 2018 yearly statistics | |
|---|---|
| distance travelled | 163117 km ⚙️ |
| time at sea | 6521 hours |
| 2018 average statistics per journey | |
|---|---|
| average persons transported 🙎♀️ | 347 persons ⚙️ |
| average freight transported 🚛 | 28 metric tons ⚙️ |
| average speed | 25 km/h ⚙️ |
2018 monitoring methods:
N/A
2018 Theoretical
N/A
﹖ details
ℹ️
Figures with the icon ⚙️ were computed based on the published data.
You can find computation details on
this page ↗
GreenFerries is a hobby project, all the data shown here has no official value. It is Open Source, so you can double check and modify it.

The Ecoscore compares
average CO₂ emissions per passenger per km.
‟emits like 2.1 planes” means that the ferry emits more than twice what an average plane would on the same distance for one passenger.