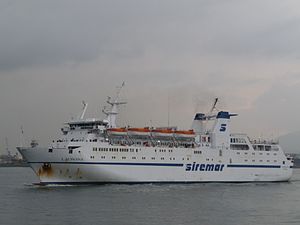
Laurana

better than riding a car with two passengers
(based on 2022 data)
Often travels on 0 routes
⚠️
Do you know of a route that this ship frequently travels but is not listed? Or have you noticed an error?
Please help by letting us know, thank you 🙇🏽♀️
Please help by letting us know, thank you 🙇🏽♀️
Ship Statistics
| 2022 yearly CO₂ Emissions | |||
|---|---|---|---|
| assigned to | total | average | ratio |
| persons 🙎♀️ | 596 tonnes CO₂ | 81 g·CO₂/pax/n.mile | 6 % ⚙️ |
| freight 🚛 | 10197 tonnes CO₂ | 1085 kg·CO₂/m tonne/n.mile | 94 % ⚙️ |
| total | 10792 tonnes CO₂ | 291 kg·CO₂/n.mile | 100% |
| 2022 yearly statistics | |
|---|---|
| distance travelled | 68749 km ⚙️ |
| time at sea | 2887 hours |
| 2022 average statistics per journey | |
|---|---|
| average persons transported 🙎♀️ | 197 persons ⚙️ |
| average freight transported 🚛 | 253 metric tons ⚙️ |
| average speed | 24 km/h ⚙️ |
2022 monitoring methods:
N/A
2022 Theoretical
EIV (Efficiency Indicator Values): 21.84 gCO₂/ton/nautical mile
﹖ details
| 2021 yearly CO₂ Emissions | |||
|---|---|---|---|
| assigned to | total | average | ratio |
| persons 🙎♀️ | 458 tonnes CO₂ | 65 g·CO₂/pax/n.mile | 4 % ⚙️ |
| freight 🚛 | 11544 tonnes CO₂ | 873 kg·CO₂/m tonne/n.mile | 96 % ⚙️ |
| total | 12002 tonnes CO₂ | 299 kg·CO₂/n.mile | 100% |
| 2021 yearly statistics | |
|---|---|
| distance travelled | 74455 km ⚙️ |
| time at sea | 3105 hours |
| 2021 average statistics per journey | |
|---|---|
| average persons transported 🙎♀️ | 174 persons ⚙️ |
| average freight transported 🚛 | 329 metric tons ⚙️ |
| average speed | 24 km/h ⚙️ |
2021 monitoring methods:
N/A
2021 Theoretical
EIV (Efficiency Indicator Values): 21.84 gCO₂/ton/nautical mile
﹖ details
| 2020 yearly CO₂ Emissions | |||
|---|---|---|---|
| assigned to | total | average | ratio |
| persons 🙎♀️ | 580 tonnes CO₂ | 109 g·CO₂/pax/n.mile | 6 % ⚙️ |
| freight 🚛 | 8892 tonnes CO₂ | 1089 kg·CO₂/m tonne/n.mile | 94 % ⚙️ |
| total | 9472 tonnes CO₂ | 309 kg·CO₂/n.mile | 100% |
| 2020 yearly statistics | |
|---|---|
| distance travelled | 56800 km ⚙️ |
| time at sea | 2370 hours |
| 2020 average statistics per journey | |
|---|---|
| average persons transported 🙎♀️ | 174 persons ⚙️ |
| average freight transported 🚛 | 266 metric tons ⚙️ |
| average speed | 24 km/h ⚙️ |
2020 monitoring methods:
N/A
2020 Theoretical
EIV (Efficiency Indicator Values): 21.84 gCO₂/ton/nautical mile
﹖ details
| 2019 yearly CO₂ Emissions | |||
|---|---|---|---|
| assigned to | total | average | ratio |
| persons 🙎♀️ | 590 tonnes CO₂ | 135 g·CO₂/pax/n.mile | 9 % ⚙️ |
| freight 🚛 | 5762 tonnes CO₂ | 1350 kg·CO₂/m tonne/n.mile | 91 % ⚙️ |
| total | 6353 tonnes CO₂ | 312 kg·CO₂/n.mile | 100% |
| 2019 yearly statistics | |
|---|---|
| distance travelled | 37716 km ⚙️ |
| time at sea | 1614 hours |
| 2019 average statistics per journey | |
|---|---|
| average persons transported 🙎♀️ | 215 persons ⚙️ |
| average freight transported 🚛 | 210 metric tons ⚙️ |
| average speed | 23 km/h ⚙️ |
2019 monitoring methods:
N/A
2019 Theoretical
EIV (Efficiency Indicator Values): 21.84 gCO₂/ton/nautical mile
﹖ details
| 2018 yearly CO₂ Emissions | |||
|---|---|---|---|
| assigned to | total | average | ratio |
| persons 🙎♀️ | 11131 tonnes CO₂ | 1717 g·CO₂/pax/n.mile | 100 % ⚙️ |
| freight 🚛 | 11131 tonnes CO₂ | 1211 kg·CO₂/m tonne/n.mile | N/A |
| total | 11131 tonnes CO₂ | 317 kg·CO₂/n.mile | 100% |
| 2018 yearly statistics | |
|---|---|
| distance travelled | 64974 km ⚙️ |
| time at sea | 2759 hours |
| 2018 average statistics per journey | |
|---|---|
| average persons transported 🙎♀️ | 185 persons ⚙️ |
| average freight transported 🚛 | 262 metric tons ⚙️ |
| average speed | 24 km/h ⚙️ |
2018 monitoring methods:
N/A
2018 Theoretical
EIV (Efficiency Indicator Values): 21.84 gCO₂/ton/nautical mile
﹖ details
ℹ️
Figures with the icon ⚙️ were computed based on the published data.
You can find computation details on
this page ↗
GreenFerries is a hobby project, all the data shown here has no official value. It is Open Source, so you can double check and modify it.

The Ecoscore compares
average CO₂ emissions per passenger per km.
‟emits like 2.1 planes” means that the ferry emits more than twice what an average plane would on the same distance for one passenger.