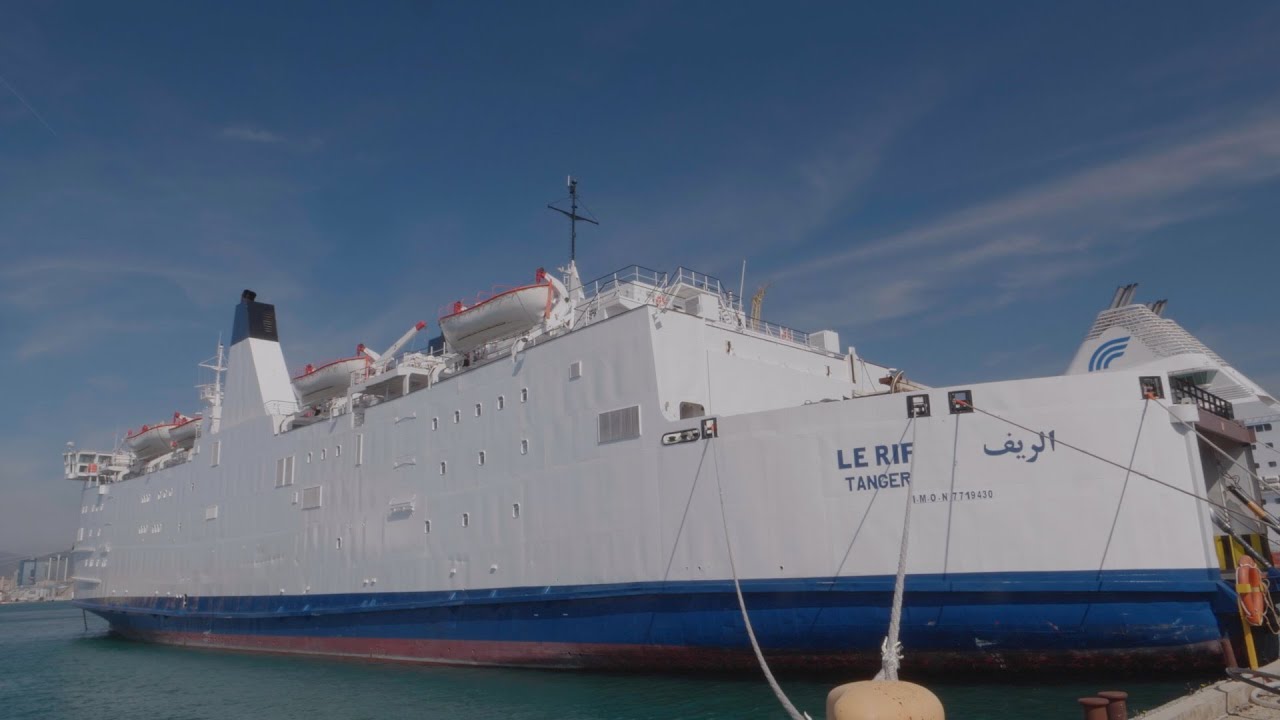
Le Rif

1 to 2 times an average plane's emissions
(based on 2022 data)
Often travels on 0 routes
⚠️
Do you know of a route that this ship frequently travels but is not listed? Or have you noticed an error?
Please help by letting us know, thank you 🙇🏽♀️
Please help by letting us know, thank you 🙇🏽♀️
Ship Statistics
| 2022 yearly CO₂ Emissions | |||
|---|---|---|---|
| assigned to | total | average | ratio |
| persons 🙎♀️ | 1668 tonnes CO₂ | 456 g·CO₂/pax/n.mile | 16 % ⚙️ |
| freight 🚛 | 8463 tonnes CO₂ | 587 kg·CO₂/m tonne/n.mile | 84 % ⚙️ |
| total | 10131 tonnes CO₂ | 321 kg·CO₂/n.mile | 100% |
| 2022 yearly statistics | |
|---|---|
| distance travelled | 58523 km ⚙️ |
| time at sea | 3012 hours |
| 2022 average statistics per journey | |
|---|---|
| average persons transported 🙎♀️ | 116 persons ⚙️ |
| average freight transported 🚛 | 456 metric tons ⚙️ |
| average speed | 19 km/h ⚙️ |
2022 monitoring methods:
N/A
2022 Theoretical
EIV (Efficiency Indicator Values): 44.97 gCO₂/ton/nautical mile
﹖ details
| 2021 yearly CO₂ Emissions | |||
|---|---|---|---|
| assigned to | total | average | ratio |
| persons 🙎♀️ | 54 tonnes CO₂ | 59 g·CO₂/pax/n.mile | 0.6136891919007456 % ⚙️ |
| freight 🚛 | 8817 tonnes CO₂ | 588 kg·CO₂/m tonne/n.mile | 99 % ⚙️ |
| total | 8871 tonnes CO₂ | 344 kg·CO₂/n.mile | 100% |
| 2021 yearly statistics | |
|---|---|
| distance travelled | 47709 km ⚙️ |
| time at sea | 2418 hours |
| 2021 average statistics per journey | |
|---|---|
| average persons transported 🙎♀️ | 36 persons ⚙️ |
| average freight transported 🚛 | 582 metric tons ⚙️ |
| average speed | 20 km/h ⚙️ |
2021 monitoring methods:
N/A
2021 Theoretical
EIV (Efficiency Indicator Values): 44.97 gCO₂/ton/nautical mile
﹖ details
| 2020 yearly CO₂ Emissions | |||
|---|---|---|---|
| assigned to | total | average | ratio |
| persons 🙎♀️ | 11 tonnes CO₂ | 52 g·CO₂/pax/n.mile | 0.3924137954941745 % ⚙️ |
| freight 🚛 | 2873 tonnes CO₂ | 830 kg·CO₂/m tonne/n.mile | 100 % ⚙️ |
| total | 2885 tonnes CO₂ | 400 kg·CO₂/n.mile | 100% |
| 2020 yearly statistics | |
|---|---|
| distance travelled | 13372 km ⚙️ |
| time at sea | 910 hours |
| 2020 average statistics per journey | |
|---|---|
| average persons transported 🙎♀️ | 30 persons ⚙️ |
| average freight transported 🚛 | 480 metric tons ⚙️ |
| average speed | 15 km/h ⚙️ |
2020 monitoring methods:
N/A
2020 Theoretical
EIV (Efficiency Indicator Values): 44.97 gCO₂/ton/nautical mile
﹖ details
| 2019 yearly CO₂ Emissions | |||
|---|---|---|---|
| assigned to | total | average | ratio |
| persons 🙎♀️ | 676 tonnes CO₂ | 1100 g·CO₂/pax/n.mile | 58 % ⚙️ |
| freight 🚛 | 554 tonnes CO₂ | 539 kg·CO₂/m tonne/n.mile | 42 % ⚙️ |
| total | 1172 tonnes CO₂ | 358 kg·CO₂/n.mile | 100% |
| 2019 yearly statistics | |
|---|---|
| distance travelled | 6058 km ⚙️ |
| time at sea | 310 hours |
| 2019 average statistics per journey | |
|---|---|
| average persons transported 🙎♀️ | 188 persons ⚙️ |
| average freight transported 🚛 | 314 metric tons ⚙️ |
| average speed | 20 km/h ⚙️ |
2019 monitoring methods:
N/A
2019 Theoretical
EIV (Efficiency Indicator Values): 44.97 gCO₂/ton/nautical mile
﹖ details
| 2018 yearly CO₂ Emissions | |||
|---|---|---|---|
| assigned to | total | average | ratio |
| persons 🙎♀️ | N/A | N/A | N/A |
| freight 🚛 | N/A | N/A | N/A |
| total | N/A | N/A | 100% |
| 2018 yearly statistics | |
|---|---|
| distance travelled | N/A |
| time at sea | N/A |
| 2018 average statistics per journey | |
|---|---|
| average persons transported 🙎♀️ | N/A |
| average freight transported 🚛 | N/A |
| average speed | N/A |
2018 monitoring methods:
N/A
2018 Theoretical
N/A
﹖ details
ℹ️
Figures with the icon ⚙️ were computed based on the published data.
You can find computation details on
this page ↗
GreenFerries is a hobby project, all the data shown here has no official value. It is Open Source, so you can double check and modify it.

The Ecoscore compares
average CO₂ emissions per passenger per km.
‟emits like 2.1 planes” means that the ferry emits more than twice what an average plane would on the same distance for one passenger.