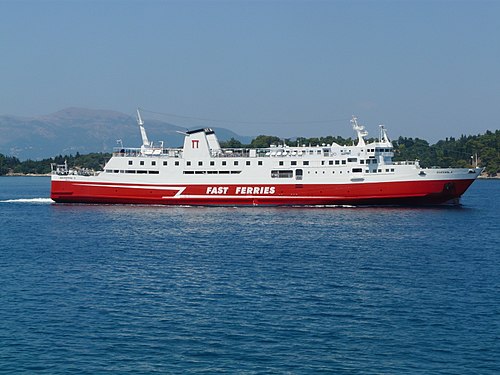
M/S Ekaterini P

1 to 2 times an average plane's emissions
(based on 2022 data)
Often travels on 1 routes
- Corfu [GR] ↔ Igoumenitsa [GR] - 32 km
⚠️
Do you know of a route that this ship frequently travels but is not listed? Or have you noticed an error?
Please help by letting us know, thank you 🙇🏽♀️
Please help by letting us know, thank you 🙇🏽♀️
Ship Statistics
| 2022 yearly CO₂ Emissions | |||
|---|---|---|---|
| assigned to | total | average | ratio |
| persons 🙎♀️ | 13105 tonnes CO₂ | 406 g·CO₂/pax/n.mile | 100 % ⚙️ |
| freight 🚛 | 13105 tonnes CO₂ | 978 kg·CO₂/m tonne/n.mile | N/A |
| total | 13105 tonnes CO₂ | 271 kg·CO₂/n.mile | 100% |
| 2022 yearly statistics | |
|---|---|
| distance travelled | 89721 km ⚙️ |
| time at sea | 3006 hours |
| 2022 average statistics per journey | |
|---|---|
| average persons transported 🙎♀️ | 666 persons ⚙️ |
| average freight transported 🚛 | 277 metric tons ⚙️ |
| average speed | 30 km/h ⚙️ |
2022 monitoring methods:
N/A
2022 Theoretical
EIV (Efficiency Indicator Values): 235.08 gCO₂/ton/nautical mile
﹖ details
| 2021 yearly CO₂ Emissions | |||
|---|---|---|---|
| assigned to | total | average | ratio |
| persons 🙎♀️ | 6208 tonnes CO₂ | 384 g·CO₂/pax/n.mile | 100 % ⚙️ |
| freight 🚛 | 6208 tonnes CO₂ | 757 kg·CO₂/m tonne/n.mile | N/A |
| total | 6208 tonnes CO₂ | 236 kg·CO₂/n.mile | 100% |
| 2021 yearly statistics | |
|---|---|
| distance travelled | 48724 km ⚙️ |
| time at sea | 1385 hours |
| 2021 average statistics per journey | |
|---|---|
| average persons transported 🙎♀️ | 614 persons ⚙️ |
| average freight transported 🚛 | 312 metric tons ⚙️ |
| average speed | 35 km/h ⚙️ |
2021 monitoring methods:
N/A
2021 Theoretical
EIV (Efficiency Indicator Values): 235.08 gCO₂/ton/nautical mile
﹖ details
| 2020 yearly CO₂ Emissions | |||
|---|---|---|---|
| assigned to | total | average | ratio |
| persons 🙎♀️ | N/A | N/A | N/A |
| freight 🚛 | N/A | N/A | N/A |
| total | N/A | N/A | 100% |
| 2020 yearly statistics | |
|---|---|
| distance travelled | N/A |
| time at sea | N/A |
| 2020 average statistics per journey | |
|---|---|
| average persons transported 🙎♀️ | N/A |
| average freight transported 🚛 | N/A |
| average speed | N/A |
2020 monitoring methods:
N/A
2020 Theoretical
N/A
﹖ details
| 2019 yearly CO₂ Emissions | |||
|---|---|---|---|
| assigned to | total | average | ratio |
| persons 🙎♀️ | 463 tonnes CO₂ | 2528 g·CO₂/pax/n.mile | 100 % ⚙️ |
| freight 🚛 | 463 tonnes CO₂ | 3464 kg·CO₂/m tonne/n.mile | N/A |
| total | 463 tonnes CO₂ | 167 kg·CO₂/n.mile | 100% |
| 2019 yearly statistics | |
|---|---|
| distance travelled | 5139 km ⚙️ |
| time at sea | 162 hours |
| 2019 average statistics per journey | |
|---|---|
| average persons transported 🙎♀️ | 66 persons ⚙️ |
| average freight transported 🚛 | 48 metric tons ⚙️ |
| average speed | 32 km/h ⚙️ |
2019 monitoring methods:
N/A
2019 Theoretical
EIV (Efficiency Indicator Values): 235.08 gCO₂/ton/nautical mile
﹖ details
| 2018 yearly CO₂ Emissions | |||
|---|---|---|---|
| assigned to | total | average | ratio |
| persons 🙎♀️ | 8168 tonnes CO₂ | 2480 g·CO₂/pax/n.mile | 100 % ⚙️ |
| freight 🚛 | 8168 tonnes CO₂ | 5453 kg·CO₂/m tonne/n.mile | N/A |
| total | 8168 tonnes CO₂ | 239 kg·CO₂/n.mile | 100% |
| 2018 yearly statistics | |
|---|---|
| distance travelled | 63371 km ⚙️ |
| time at sea | 1814 hours |
| 2018 average statistics per journey | |
|---|---|
| average persons transported 🙎♀️ | 96 persons ⚙️ |
| average freight transported 🚛 | 44 metric tons ⚙️ |
| average speed | 35 km/h ⚙️ |
2018 monitoring methods:
N/A
2018 Theoretical
N/A
﹖ details
ℹ️
Figures with the icon ⚙️ were computed based on the published data.
You can find computation details on
this page ↗
GreenFerries is a hobby project, all the data shown here has no official value. It is Open Source, so you can double check and modify it.

The Ecoscore compares
average CO₂ emissions per passenger per km.
‟emits like 2.1 planes” means that the ferry emits more than twice what an average plane would on the same distance for one passenger.