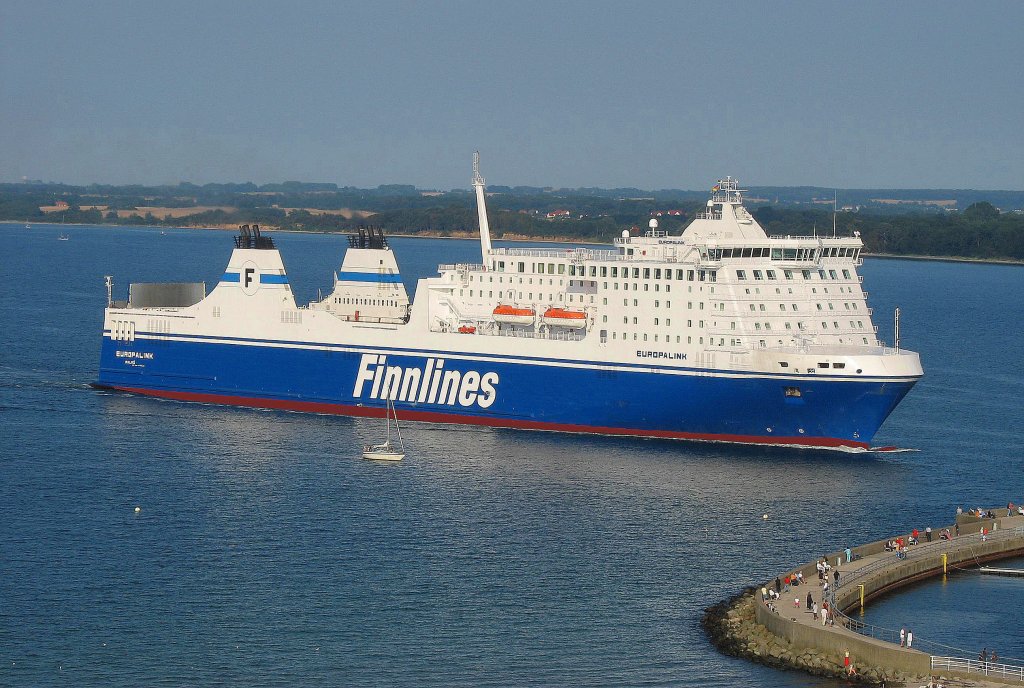
M/S Europalink

better than riding a car with two passengers
(based on 2022 data)
Often travels on 1 routes
- Travemunde [DE] ↔ Malmo [SE] - 228 km
⚠️
Do you know of a route that this ship frequently travels but is not listed? Or have you noticed an error?
Please help by letting us know, thank you 🙇🏽♀️
Please help by letting us know, thank you 🙇🏽♀️
Ship Statistics
| 2022 yearly CO₂ Emissions | |||
|---|---|---|---|
| assigned to | total | average | ratio |
| persons 🙎♀️ | 1603 tonnes CO₂ | 143 g·CO₂/pax/n.mile | 3 % ⚙️ |
| freight 🚛 | 45957 tonnes CO₂ | 185 kg·CO₂/m tonne/n.mile | 97 % ⚙️ |
| total | 47560 tonnes CO₂ | 580 kg·CO₂/n.mile | 100% |
| 2022 yearly statistics | |
|---|---|
| distance travelled | 151841 km ⚙️ |
| time at sea | 5949 hours |
| 2022 average statistics per journey | |
|---|---|
| average persons transported 🙎♀️ | 137 persons ⚙️ |
| average freight transported 🚛 | 3036 metric tons ⚙️ |
| average speed | 26 km/h ⚙️ |
2022 monitoring methods:
N/A
2022 Theoretical
EIV (Efficiency Indicator Values): 3.83 gCO₂/ton/nautical mile
﹖ details
| 2021 yearly CO₂ Emissions | |||
|---|---|---|---|
| assigned to | total | average | ratio |
| persons 🙎♀️ | 1015 tonnes CO₂ | 75 g·CO₂/pax/n.mile | 2 % ⚙️ |
| freight 🚛 | 49644 tonnes CO₂ | 127 kg·CO₂/m tonne/n.mile | 98 % ⚙️ |
| total | 50659 tonnes CO₂ | 616 kg·CO₂/n.mile | 100% |
| 2021 yearly statistics | |
|---|---|
| distance travelled | 152208 km ⚙️ |
| time at sea | 5416 hours |
| 2021 average statistics per journey | |
|---|---|
| average persons transported 🙎♀️ | 165 persons ⚙️ |
| average freight transported 🚛 | 4751 metric tons ⚙️ |
| average speed | 28 km/h ⚙️ |
2021 monitoring methods:
N/A
2021 Theoretical
EIV (Efficiency Indicator Values): 3.83 gCO₂/ton/nautical mile
﹖ details
| 2020 yearly CO₂ Emissions | |||
|---|---|---|---|
| assigned to | total | average | ratio |
| persons 🙎♀️ | 994 tonnes CO₂ | 81 g·CO₂/pax/n.mile | 2 % ⚙️ |
| freight 🚛 | 48837 tonnes CO₂ | 139 kg·CO₂/m tonne/n.mile | 98 % ⚙️ |
| total | 49831 tonnes CO₂ | 592 kg·CO₂/n.mile | 100% |
| 2020 yearly statistics | |
|---|---|
| distance travelled | 156018 km ⚙️ |
| time at sea | 5718 hours |
| 2020 average statistics per journey | |
|---|---|
| average persons transported 🙎♀️ | 146 persons ⚙️ |
| average freight transported 🚛 | 4169 metric tons ⚙️ |
| average speed | 27 km/h ⚙️ |
2020 monitoring methods:
N/A
2020 Theoretical
EIV (Efficiency Indicator Values): 3.83 gCO₂/ton/nautical mile
﹖ details
| 2019 yearly CO₂ Emissions | |||
|---|---|---|---|
| assigned to | total | average | ratio |
| persons 🙎♀️ | 2067 tonnes CO₂ | 101 g·CO₂/pax/n.mile | 4 % ⚙️ |
| freight 🚛 | 49708 tonnes CO₂ | 130 kg·CO₂/m tonne/n.mile | 96 % ⚙️ |
| total | 51775 tonnes CO₂ | 609 kg·CO₂/n.mile | 100% |
| 2019 yearly statistics | |
|---|---|
| distance travelled | 157326 km ⚙️ |
| time at sea | 5693 hours |
| 2019 average statistics per journey | |
|---|---|
| average persons transported 🙎♀️ | 241 persons ⚙️ |
| average freight transported 🚛 | 4494 metric tons ⚙️ |
| average speed | 28 km/h ⚙️ |
2019 monitoring methods:
N/A
2019 Theoretical
EIV (Efficiency Indicator Values): 3.83 gCO₂/ton/nautical mile
﹖ details
| 2018 yearly CO₂ Emissions | |||
|---|---|---|---|
| assigned to | total | average | ratio |
| persons 🙎♀️ | 1588 tonnes CO₂ | 114 g·CO₂/pax/n.mile | 3 % ⚙️ |
| freight 🚛 | 38135 tonnes CO₂ | 130 kg·CO₂/m tonne/n.mile | 97 % ⚙️ |
| total | 46328 tonnes CO₂ | 651 kg·CO₂/n.mile | 100% |
| 2018 yearly statistics | |
|---|---|
| distance travelled | 131847 km ⚙️ |
| time at sea | 4616 hours |
| 2018 average statistics per journey | |
|---|---|
| average persons transported 🙎♀️ | 195 persons ⚙️ |
| average freight transported 🚛 | 4126 metric tons ⚙️ |
| average speed | 29 km/h ⚙️ |
2018 monitoring methods:
N/A
2018 Theoretical
EIV (Efficiency Indicator Values): 12.88 gCO₂/ton/nautical mile
﹖ details
ℹ️
Figures with the icon ⚙️ were computed based on the published data.
You can find computation details on
this page ↗
GreenFerries is a hobby project, all the data shown here has no official value. It is Open Source, so you can double check and modify it.

The Ecoscore compares
average CO₂ emissions per passenger per km.
‟emits like 2.1 planes” means that the ferry emits more than twice what an average plane would on the same distance for one passenger.