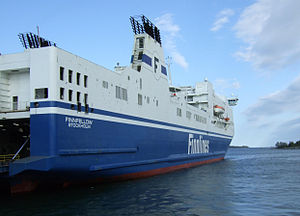
M/S Finnfellow

better than riding a car with two passengers
(based on 2022 data)
Often travels on 1 routes
- Naantali [FI] ↔ Kapellskär [SE] - 184 km
⚠️
Do you know of a route that this ship frequently travels but is not listed? Or have you noticed an error?
Please help by letting us know, thank you 🙇🏽♀️
Please help by letting us know, thank you 🙇🏽♀️
Ship Statistics
| 2022 yearly CO₂ Emissions | |||
|---|---|---|---|
| assigned to | total | average | ratio |
| persons 🙎♀️ | 874 tonnes CO₂ | 70 g·CO₂/pax/n.mile | 2 % ⚙️ |
| freight 🚛 | 42395 tonnes CO₂ | 143 kg·CO₂/m tonne/n.mile | 98 % ⚙️ |
| total | 43269 tonnes CO₂ | 506 kg·CO₂/n.mile | 100% |
| 2022 yearly statistics | |
|---|---|
| distance travelled | 158304 km ⚙️ |
| time at sea | 5646 hours |
| 2022 average statistics per journey | |
|---|---|
| average persons transported 🙎♀️ | 146 persons ⚙️ |
| average freight transported 🚛 | 3472 metric tons ⚙️ |
| average speed | 28 km/h ⚙️ |
2022 monitoring methods:
N/A
2022 Theoretical
EIV (Efficiency Indicator Values): 3.12 gCO₂/ton/nautical mile
﹖ details
| 2021 yearly CO₂ Emissions | |||
|---|---|---|---|
| assigned to | total | average | ratio |
| persons 🙎♀️ | 686 tonnes CO₂ | 74 g·CO₂/pax/n.mile | 2 % ⚙️ |
| freight 🚛 | 33526 tonnes CO₂ | 134 kg·CO₂/m tonne/n.mile | 98 % ⚙️ |
| total | 34212 tonnes CO₂ | 425 kg·CO₂/n.mile | 100% |
| 2021 yearly statistics | |
|---|---|
| distance travelled | 149088 km ⚙️ |
| time at sea | 5921 hours |
| 2021 average statistics per journey | |
|---|---|
| average persons transported 🙎♀️ | 115 persons ⚙️ |
| average freight transported 🚛 | 3107 metric tons ⚙️ |
| average speed | 25 km/h ⚙️ |
2021 monitoring methods:
N/A
2021 Theoretical
EIV (Efficiency Indicator Values): 3.12 gCO₂/ton/nautical mile
﹖ details
| 2020 yearly CO₂ Emissions | |||
|---|---|---|---|
| assigned to | total | average | ratio |
| persons 🙎♀️ | 692 tonnes CO₂ | 88 g·CO₂/pax/n.mile | 2 % ⚙️ |
| freight 🚛 | 33898 tonnes CO₂ | 152 kg·CO₂/m tonne/n.mile | 98 % ⚙️ |
| total | 34590 tonnes CO₂ | 425 kg·CO₂/n.mile | 100% |
| 2020 yearly statistics | |
|---|---|
| distance travelled | 150613 km ⚙️ |
| time at sea | 6018 hours |
| 2020 average statistics per journey | |
|---|---|
| average persons transported 🙎♀️ | 96 persons ⚙️ |
| average freight transported 🚛 | 2750 metric tons ⚙️ |
| average speed | 25 km/h ⚙️ |
2020 monitoring methods:
N/A
2020 Theoretical
EIV (Efficiency Indicator Values): 3.12 gCO₂/ton/nautical mile
﹖ details
| 2019 yearly CO₂ Emissions | |||
|---|---|---|---|
| assigned to | total | average | ratio |
| persons 🙎♀️ | 1306 tonnes CO₂ | 132 g·CO₂/pax/n.mile | 4 % ⚙️ |
| freight 🚛 | 31301 tonnes CO₂ | 145 kg·CO₂/m tonne/n.mile | 96 % ⚙️ |
| total | 32608 tonnes CO₂ | 428 kg·CO₂/n.mile | 100% |
| 2019 yearly statistics | |
|---|---|
| distance travelled | 140988 km ⚙️ |
| time at sea | 5734 hours |
| 2019 average statistics per journey | |
|---|---|
| average persons transported 🙎♀️ | 130 persons ⚙️ |
| average freight transported 🚛 | 2829 metric tons ⚙️ |
| average speed | 25 km/h ⚙️ |
2019 monitoring methods:
N/A
2019 Theoretical
EIV (Efficiency Indicator Values): 3.12 gCO₂/ton/nautical mile
﹖ details
| 2018 yearly CO₂ Emissions | |||
|---|---|---|---|
| assigned to | total | average | ratio |
| persons 🙎♀️ | 1150 tonnes CO₂ | 115 g·CO₂/pax/n.mile | 3 % ⚙️ |
| freight 🚛 | 27536 tonnes CO₂ | 133 kg·CO₂/m tonne/n.mile | 97 % ⚙️ |
| total | 34685 tonnes CO₂ | 433 kg·CO₂/n.mile | 100% |
| 2018 yearly statistics | |
|---|---|
| distance travelled | 148475 km ⚙️ |
| time at sea | 6026 hours |
| 2018 average statistics per journey | |
|---|---|
| average persons transported 🙎♀️ | 125 persons ⚙️ |
| average freight transported 🚛 | 2585 metric tons ⚙️ |
| average speed | 25 km/h ⚙️ |
2018 monitoring methods:
N/A
2018 Theoretical
EIV (Efficiency Indicator Values): 16.49 gCO₂/ton/nautical mile
﹖ details
ℹ️
Figures with the icon ⚙️ were computed based on the published data.
You can find computation details on
this page ↗
GreenFerries is a hobby project, all the data shown here has no official value. It is Open Source, so you can double check and modify it.

The Ecoscore compares
average CO₂ emissions per passenger per km.
‟emits like 2.1 planes” means that the ferry emits more than twice what an average plane would on the same distance for one passenger.