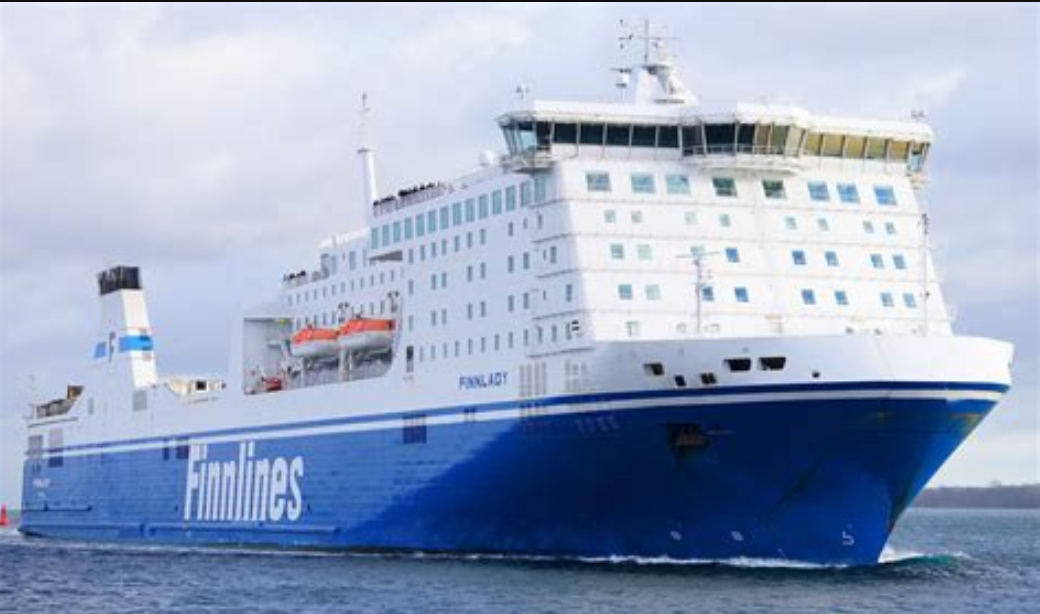
M/S Finnlady

better than riding a car with two passengers
(based on 2022 data)
Often travels on 0 routes
⚠️
Do you know of a route that this ship frequently travels but is not listed? Or have you noticed an error?
Please help by letting us know, thank you 🙇🏽♀️
Please help by letting us know, thank you 🙇🏽♀️
Ship Statistics
| 2022 yearly CO₂ Emissions | |||
|---|---|---|---|
| assigned to | total | average | ratio |
| persons 🙎♀️ | 3835 tonnes CO₂ | 125 g·CO₂/pax/n.mile | 4 % ⚙️ |
| freight 🚛 | 97893 tonnes CO₂ | 129 kg·CO₂/m tonne/n.mile | 96 % ⚙️ |
| total | 101728 tonnes CO₂ | 706 kg·CO₂/n.mile | 100% |
| 2022 yearly statistics | |
|---|---|
| distance travelled | 266952 km ⚙️ |
| time at sea | 6808 hours |
| 2022 average statistics per journey | |
|---|---|
| average persons transported 🙎♀️ | 213 persons ⚙️ |
| average freight transported 🚛 | 5278 metric tons ⚙️ |
| average speed | 39 km/h ⚙️ |
2022 monitoring methods:
N/A
2022 Theoretical
EIV (Efficiency Indicator Values): 2.99 gCO₂/ton/nautical mile
﹖ details
| 2021 yearly CO₂ Emissions | |||
|---|---|---|---|
| assigned to | total | average | ratio |
| persons 🙎♀️ | 2103 tonnes CO₂ | 102 g·CO₂/pax/n.mile | 2 % ⚙️ |
| freight 🚛 | 103004 tonnes CO₂ | 129 kg·CO₂/m tonne/n.mile | 98 % ⚙️ |
| total | 105108 tonnes CO₂ | 718 kg·CO₂/n.mile | 100% |
| 2021 yearly statistics | |
|---|---|
| distance travelled | 271223 km ⚙️ |
| time at sea | 6893 hours |
| 2021 average statistics per journey | |
|---|---|
| average persons transported 🙎♀️ | 141 persons ⚙️ |
| average freight transported 🚛 | 5449 metric tons ⚙️ |
| average speed | 39 km/h ⚙️ |
2021 monitoring methods:
N/A
2021 Theoretical
EIV (Efficiency Indicator Values): 2.99 gCO₂/ton/nautical mile
﹖ details
| 2020 yearly CO₂ Emissions | |||
|---|---|---|---|
| assigned to | total | average | ratio |
| persons 🙎♀️ | 2097 tonnes CO₂ | 116 g·CO₂/pax/n.mile | 2 % ⚙️ |
| freight 🚛 | 102758 tonnes CO₂ | 148 kg·CO₂/m tonne/n.mile | 98 % ⚙️ |
| total | 104854 tonnes CO₂ | 710 kg·CO₂/n.mile | 100% |
| 2020 yearly statistics | |
|---|---|
| distance travelled | 273468 km ⚙️ |
| time at sea | 7011 hours |
| 2020 average statistics per journey | |
|---|---|
| average persons transported 🙎♀️ | 122 persons ⚙️ |
| average freight transported 🚛 | 4707 metric tons ⚙️ |
| average speed | 39 km/h ⚙️ |
2020 monitoring methods:
N/A
2020 Theoretical
EIV (Efficiency Indicator Values): 2.99 gCO₂/ton/nautical mile
﹖ details
| 2019 yearly CO₂ Emissions | |||
|---|---|---|---|
| assigned to | total | average | ratio |
| persons 🙎♀️ | 4064 tonnes CO₂ | 124 g·CO₂/pax/n.mile | 4 % ⚙️ |
| freight 🚛 | 97528 tonnes CO₂ | 136 kg·CO₂/m tonne/n.mile | 96 % ⚙️ |
| total | 101591 tonnes CO₂ | 700 kg·CO₂/n.mile | 100% |
| 2019 yearly statistics | |
|---|---|
| distance travelled | 268947 km ⚙️ |
| time at sea | 6852 hours |
| 2019 average statistics per journey | |
|---|---|
| average persons transported 🙎♀️ | 226 persons ⚙️ |
| average freight transported 🚛 | 4921 metric tons ⚙️ |
| average speed | 39 km/h ⚙️ |
2019 monitoring methods:
N/A
2019 Theoretical
EIV (Efficiency Indicator Values): 2.99 gCO₂/ton/nautical mile
﹖ details
| 2018 yearly CO₂ Emissions | |||
|---|---|---|---|
| assigned to | total | average | ratio |
| persons 🙎♀️ | 4036 tonnes CO₂ | 129 g·CO₂/pax/n.mile | 4 % ⚙️ |
| freight 🚛 | 96870 tonnes CO₂ | 143 kg·CO₂/m tonne/n.mile | 96 % ⚙️ |
| total | 103605 tonnes CO₂ | 713 kg·CO₂/n.mile | 100% |
| 2018 yearly statistics | |
|---|---|
| distance travelled | 269267 km ⚙️ |
| time at sea | 6843 hours |
| 2018 average statistics per journey | |
|---|---|
| average persons transported 🙎♀️ | 215 persons ⚙️ |
| average freight transported 🚛 | 4673 metric tons ⚙️ |
| average speed | 39 km/h ⚙️ |
2018 monitoring methods:
N/A
2018 Theoretical
EIV (Efficiency Indicator Values): 12.93 gCO₂/ton/nautical mile
﹖ details
ℹ️
Figures with the icon ⚙️ were computed based on the published data.
You can find computation details on
this page ↗
GreenFerries is a hobby project, all the data shown here has no official value. It is Open Source, so you can double check and modify it.

The Ecoscore compares
average CO₂ emissions per passenger per km.
‟emits like 2.1 planes” means that the ferry emits more than twice what an average plane would on the same distance for one passenger.