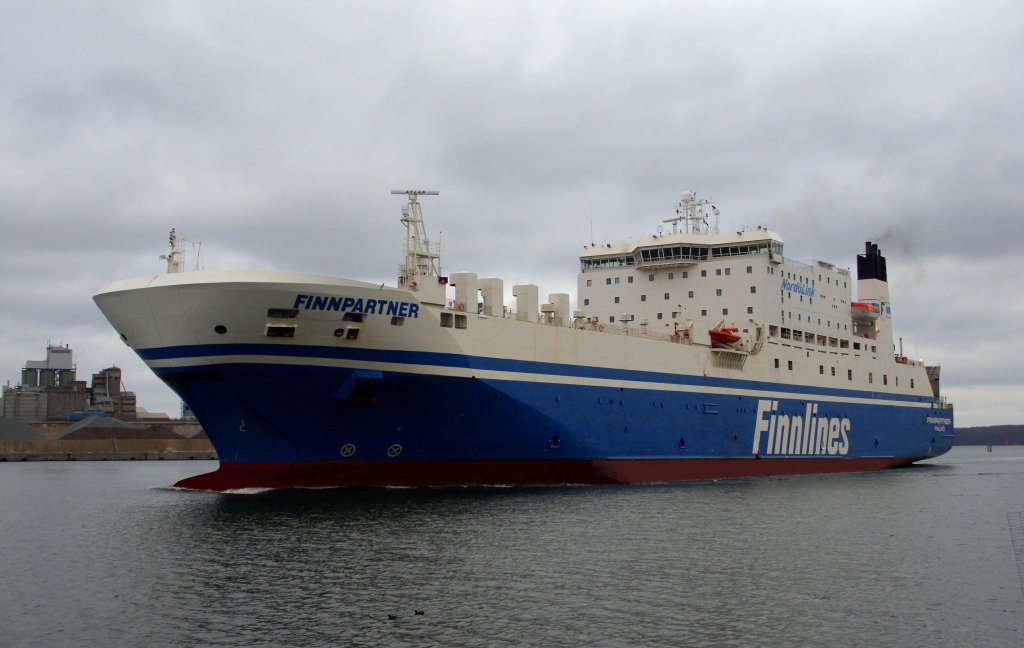
M/S Finnpartner

better than riding a car with two passengers
(based on 2022 data)
Often travels on 0 routes
⚠️
Do you know of a route that this ship frequently travels but is not listed? Or have you noticed an error?
Please help by letting us know, thank you 🙇🏽♀️
Please help by letting us know, thank you 🙇🏽♀️
Ship Statistics
| 2022 yearly CO₂ Emissions | |||
|---|---|---|---|
| assigned to | total | average | ratio |
| persons 🙎♀️ | 757 tonnes CO₂ | 60 g·CO₂/pax/n.mile | 2 % ⚙️ |
| freight 🚛 | 40858 tonnes CO₂ | 121 kg·CO₂/m tonne/n.mile | 98 % ⚙️ |
| total | 41615 tonnes CO₂ | 489 kg·CO₂/n.mile | 100% |
| 2022 yearly statistics | |
|---|---|
| distance travelled | 157517 km ⚙️ |
| time at sea | 5556 hours |
| 2022 average statistics per journey | |
|---|---|
| average persons transported 🙎♀️ | 147 persons ⚙️ |
| average freight transported 🚛 | 3968 metric tons ⚙️ |
| average speed | 28 km/h ⚙️ |
2022 monitoring methods:
N/A
2022 Theoretical
EIV (Efficiency Indicator Values): 4.34 gCO₂/ton/nautical mile
﹖ details
| 2021 yearly CO₂ Emissions | |||
|---|---|---|---|
| assigned to | total | average | ratio |
| persons 🙎♀️ | 871 tonnes CO₂ | 70 g·CO₂/pax/n.mile | 2 % ⚙️ |
| freight 🚛 | 42855 tonnes CO₂ | 126 kg·CO₂/m tonne/n.mile | 98 % ⚙️ |
| total | 43726 tonnes CO₂ | 479 kg·CO₂/n.mile | 100% |
| 2021 yearly statistics | |
|---|---|
| distance travelled | 169155 km ⚙️ |
| time at sea | 5885 hours |
| 2021 average statistics per journey | |
|---|---|
| average persons transported 🙎♀️ | 136 persons ⚙️ |
| average freight transported 🚛 | 3724 metric tons ⚙️ |
| average speed | 29 km/h ⚙️ |
2021 monitoring methods:
N/A
2021 Theoretical
EIV (Efficiency Indicator Values): 4.34 gCO₂/ton/nautical mile
﹖ details
| 2020 yearly CO₂ Emissions | |||
|---|---|---|---|
| assigned to | total | average | ratio |
| persons 🙎♀️ | 849 tonnes CO₂ | 73 g·CO₂/pax/n.mile | 2 % ⚙️ |
| freight 🚛 | 41542 tonnes CO₂ | 138 kg·CO₂/m tonne/n.mile | 98 % ⚙️ |
| total | 42391 tonnes CO₂ | 460 kg·CO₂/n.mile | 100% |
| 2020 yearly statistics | |
|---|---|
| distance travelled | 170673 km ⚙️ |
| time at sea | 5936 hours |
| 2020 average statistics per journey | |
|---|---|
| average persons transported 🙎♀️ | 127 persons ⚙️ |
| average freight transported 🚛 | 3267 metric tons ⚙️ |
| average speed | 29 km/h ⚙️ |
2020 monitoring methods:
N/A
2020 Theoretical
EIV (Efficiency Indicator Values): 4.34 gCO₂/ton/nautical mile
﹖ details
| 2019 yearly CO₂ Emissions | |||
|---|---|---|---|
| assigned to | total | average | ratio |
| persons 🙎♀️ | 1590 tonnes CO₂ | 118 g·CO₂/pax/n.mile | 4 % ⚙️ |
| freight 🚛 | 38245 tonnes CO₂ | 117 kg·CO₂/m tonne/n.mile | 96 % ⚙️ |
| total | 39835 tonnes CO₂ | 440 kg·CO₂/n.mile | 100% |
| 2019 yearly statistics | |
|---|---|
| distance travelled | 167723 km ⚙️ |
| time at sea | 5811 hours |
| 2019 average statistics per journey | |
|---|---|
| average persons transported 🙎♀️ | 149 persons ⚙️ |
| average freight transported 🚛 | 3598 metric tons ⚙️ |
| average speed | 29 km/h ⚙️ |
2019 monitoring methods:
N/A
2019 Theoretical
EIV (Efficiency Indicator Values): 4.34 gCO₂/ton/nautical mile
﹖ details
| 2018 yearly CO₂ Emissions | |||
|---|---|---|---|
| assigned to | total | average | ratio |
| persons 🙎♀️ | 994 tonnes CO₂ | 72 g·CO₂/pax/n.mile | 3 % ⚙️ |
| freight 🚛 | 39602 tonnes CO₂ | 122 kg·CO₂/m tonne/n.mile | 97 % ⚙️ |
| total | 39602 tonnes CO₂ | 444 kg·CO₂/n.mile | 100% |
| 2018 yearly statistics | |
|---|---|
| distance travelled | 165345 km ⚙️ |
| time at sea | 5915 hours |
| 2018 average statistics per journey | |
|---|---|
| average persons transported 🙎♀️ | 154 persons ⚙️ |
| average freight transported 🚛 | 3634 metric tons ⚙️ |
| average speed | 28 km/h ⚙️ |
2018 monitoring methods:
N/A
2018 Theoretical
EIV (Efficiency Indicator Values): 15.27 gCO₂/ton/nautical mile
﹖ details
ℹ️
Figures with the icon ⚙️ were computed based on the published data.
You can find computation details on
this page ↗
GreenFerries is a hobby project, all the data shown here has no official value. It is Open Source, so you can double check and modify it.

The Ecoscore compares
average CO₂ emissions per passenger per km.
‟emits like 2.1 planes” means that the ferry emits more than twice what an average plane would on the same distance for one passenger.