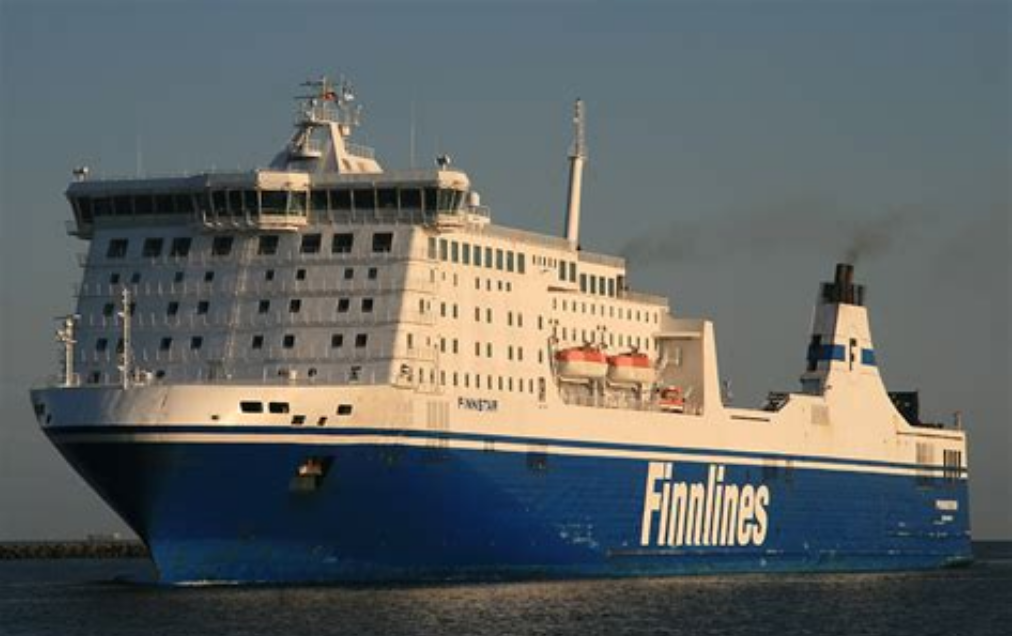
M/S Finnstar

better than riding a car with two passengers
(based on 2022 data)
Often travels on 1 routes
- Helsinki [FI] ↔ Travemunde [DE] - 1092 km
⚠️
Do you know of a route that this ship frequently travels but is not listed? Or have you noticed an error?
Please help by letting us know, thank you 🙇🏽♀️
Please help by letting us know, thank you 🙇🏽♀️
Ship Statistics
| 2022 yearly CO₂ Emissions | |||
|---|---|---|---|
| assigned to | total | average | ratio |
| persons 🙎♀️ | 3737 tonnes CO₂ | 102 g·CO₂/pax/n.mile | 4 % ⚙️ |
| freight 🚛 | 99789 tonnes CO₂ | 128 kg·CO₂/m tonne/n.mile | 96 % ⚙️ |
| total | 103526 tonnes CO₂ | 697 kg·CO₂/n.mile | 100% |
| 2022 yearly statistics | |
|---|---|
| distance travelled | 275084 km ⚙️ |
| time at sea | 7063 hours |
| 2022 average statistics per journey | |
|---|---|
| average persons transported 🙎♀️ | 246 persons ⚙️ |
| average freight transported 🚛 | 5259 metric tons ⚙️ |
| average speed | 39 km/h ⚙️ |
2022 monitoring methods:
N/A
2022 Theoretical
EIV (Efficiency Indicator Values): 3.96 gCO₂/ton/nautical mile
﹖ details
| 2021 yearly CO₂ Emissions | |||
|---|---|---|---|
| assigned to | total | average | ratio |
| persons 🙎♀️ | 2060 tonnes CO₂ | 99 g·CO₂/pax/n.mile | 2 % ⚙️ |
| freight 🚛 | 100995 tonnes CO₂ | 127 kg·CO₂/m tonne/n.mile | 98 % ⚙️ |
| total | 103055 tonnes CO₂ | 709 kg·CO₂/n.mile | 100% |
| 2021 yearly statistics | |
|---|---|
| distance travelled | 269148 km ⚙️ |
| time at sea | 6851 hours |
| 2021 average statistics per journey | |
|---|---|
| average persons transported 🙎♀️ | 143 persons ⚙️ |
| average freight transported 🚛 | 5466 metric tons ⚙️ |
| average speed | 39 km/h ⚙️ |
2021 monitoring methods:
N/A
2021 Theoretical
EIV (Efficiency Indicator Values): 3.96 gCO₂/ton/nautical mile
﹖ details
| 2020 yearly CO₂ Emissions | |||
|---|---|---|---|
| assigned to | total | average | ratio |
| persons 🙎♀️ | 2012 tonnes CO₂ | 115 g·CO₂/pax/n.mile | 2 % ⚙️ |
| freight 🚛 | 98619 tonnes CO₂ | 148 kg·CO₂/m tonne/n.mile | 98 % ⚙️ |
| total | 100631 tonnes CO₂ | 700 kg·CO₂/n.mile | 100% |
| 2020 yearly statistics | |
|---|---|
| distance travelled | 266131 km ⚙️ |
| time at sea | 6833 hours |
| 2020 average statistics per journey | |
|---|---|
| average persons transported 🙎♀️ | 122 persons ⚙️ |
| average freight transported 🚛 | 4647 metric tons ⚙️ |
| average speed | 39 km/h ⚙️ |
2020 monitoring methods:
N/A
2020 Theoretical
EIV (Efficiency Indicator Values): 3.96 gCO₂/ton/nautical mile
﹖ details
| 2019 yearly CO₂ Emissions | |||
|---|---|---|---|
| assigned to | total | average | ratio |
| persons 🙎♀️ | 4160 tonnes CO₂ | 126 g·CO₂/pax/n.mile | 4 % ⚙️ |
| freight 🚛 | 99770 tonnes CO₂ | 141 kg·CO₂/m tonne/n.mile | 96 % ⚙️ |
| total | 103929 tonnes CO₂ | 713 kg·CO₂/n.mile | 100% |
| 2019 yearly statistics | |
|---|---|
| distance travelled | 270052 km ⚙️ |
| time at sea | 6945 hours |
| 2019 average statistics per journey | |
|---|---|
| average persons transported 🙎♀️ | 227 persons ⚙️ |
| average freight transported 🚛 | 4836 metric tons ⚙️ |
| average speed | 39 km/h ⚙️ |
2019 monitoring methods:
N/A
2019 Theoretical
EIV (Efficiency Indicator Values): 3.96 gCO₂/ton/nautical mile
﹖ details
| 2018 yearly CO₂ Emissions | |||
|---|---|---|---|
| assigned to | total | average | ratio |
| persons 🙎♀️ | 3774 tonnes CO₂ | 127 g·CO₂/pax/n.mile | 4 % ⚙️ |
| freight 🚛 | 90606 tonnes CO₂ | 142 kg·CO₂/m tonne/n.mile | 96 % ⚙️ |
| total | 96584 tonnes CO₂ | 715 kg·CO₂/n.mile | 100% |
| 2018 yearly statistics | |
|---|---|
| distance travelled | 250188 km ⚙️ |
| time at sea | 6385 hours |
| 2018 average statistics per journey | |
|---|---|
| average persons transported 🙎♀️ | 219 persons ⚙️ |
| average freight transported 🚛 | 4727 metric tons ⚙️ |
| average speed | 39 km/h ⚙️ |
2018 monitoring methods:
N/A
2018 Theoretical
EIV (Efficiency Indicator Values): 12.93 gCO₂/ton/nautical mile
﹖ details
ℹ️
Figures with the icon ⚙️ were computed based on the published data.
You can find computation details on
this page ↗
GreenFerries is a hobby project, all the data shown here has no official value. It is Open Source, so you can double check and modify it.

The Ecoscore compares
average CO₂ emissions per passenger per km.
‟emits like 2.1 planes” means that the ferry emits more than twice what an average plane would on the same distance for one passenger.