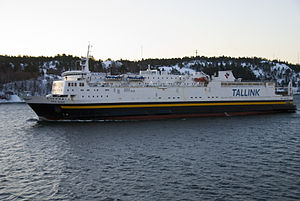
M/S Sea Wind

over 4 times an average plane's emissions
(based on 2021 data)
Often travels on 1 routes
- Tallinn [EE] ↔ Vuosaari [FI] - 88 km
⚠️
Do you know of a route that this ship frequently travels but is not listed? Or have you noticed an error?
Please help by letting us know, thank you 🙇🏽♀️
Please help by letting us know, thank you 🙇🏽♀️
Ship Statistics
| 2022 yearly CO₂ Emissions | |||
|---|---|---|---|
| assigned to | total | average | ratio |
| persons 🙎♀️ | N/A | N/A | N/A |
| freight 🚛 | N/A | N/A | N/A |
| total | N/A | N/A | 100% |
| 2022 yearly statistics | |
|---|---|
| distance travelled | N/A |
| time at sea | N/A |
| 2022 average statistics per journey | |
|---|---|
| average persons transported 🙎♀️ | N/A |
| average freight transported 🚛 | N/A |
| average speed | N/A |
2022 monitoring methods:
N/A
2022 Theoretical
N/A
﹖ details
| 2021 yearly CO₂ Emissions | |||
|---|---|---|---|
| assigned to | total | average | ratio |
| persons 🙎♀️ | 2083 tonnes CO₂ | 2068 g·CO₂/pax/n.mile | 20 % ⚙️ |
| freight 🚛 | 6183 tonnes CO₂ | 179 kg·CO₂/m tonne/n.mile | 80 % ⚙️ |
| total | 10454 tonnes CO₂ | 296 kg·CO₂/n.mile | 100% |
| 2021 yearly statistics | |
|---|---|
| distance travelled | 65384 km ⚙️ |
| time at sea | 2737 hours |
| 2021 average statistics per journey | |
|---|---|
| average persons transported 🙎♀️ | 29 persons ⚙️ |
| average freight transported 🚛 | 978 metric tons ⚙️ |
| average speed | 24 km/h ⚙️ |
2021 monitoring methods:
N/A
2021 Theoretical
EIV (Efficiency Indicator Values): 9.29 gCO₂/ton/nautical mile
﹖ details
| 2020 yearly CO₂ Emissions | |||
|---|---|---|---|
| assigned to | total | average | ratio |
| persons 🙎♀️ | 2912 tonnes CO₂ | 1541 g·CO₂/pax/n.mile | 22 % ⚙️ |
| freight 🚛 | 8348 tonnes CO₂ | 143 kg·CO₂/m tonne/n.mile | 78 % ⚙️ |
| total | 13138 tonnes CO₂ | 274 kg·CO₂/n.mile | 100% |
| 2020 yearly statistics | |
|---|---|
| distance travelled | 88772 km ⚙️ |
| time at sea | 3619 hours |
| 2020 average statistics per journey | |
|---|---|
| average persons transported 🙎♀️ | 39 persons ⚙️ |
| average freight transported 🚛 | 1214 metric tons ⚙️ |
| average speed | 25 km/h ⚙️ |
2020 monitoring methods:
N/A
2020 Theoretical
EIV (Efficiency Indicator Values): 9.29 gCO₂/ton/nautical mile
﹖ details
| 2019 yearly CO₂ Emissions | |||
|---|---|---|---|
| assigned to | total | average | ratio |
| persons 🙎♀️ | 3189 tonnes CO₂ | 1392 g·CO₂/pax/n.mile | 24 % ⚙️ |
| freight 🚛 | 7767 tonnes CO₂ | 134 kg·CO₂/m tonne/n.mile | 76 % ⚙️ |
| total | 13047 tonnes CO₂ | 265 kg·CO₂/n.mile | 100% |
| 2019 yearly statistics | |
|---|---|
| distance travelled | 91038 km ⚙️ |
| time at sea | 3826 hours |
| 2019 average statistics per journey | |
|---|---|
| average persons transported 🙎♀️ | 47 persons ⚙️ |
| average freight transported 🚛 | 1176 metric tons ⚙️ |
| average speed | 24 km/h ⚙️ |
2019 monitoring methods:
N/A
2019 Theoretical
EIV (Efficiency Indicator Values): 9.29 gCO₂/ton/nautical mile
﹖ details
| 2018 yearly CO₂ Emissions | |||
|---|---|---|---|
| assigned to | total | average | ratio |
| persons 🙎♀️ | 3085 tonnes CO₂ | 1873 g·CO₂/pax/n.mile | 24 % ⚙️ |
| freight 🚛 | 9158 tonnes CO₂ | 173 kg·CO₂/m tonne/n.mile | 76 % ⚙️ |
| total | 12912 tonnes CO₂ | 265 kg·CO₂/n.mile | 100% |
| 2018 yearly statistics | |
|---|---|
| distance travelled | 90240 km ⚙️ |
| time at sea | 3787 hours |
| 2018 average statistics per journey | |
|---|---|
| average persons transported 🙎♀️ | 34 persons ⚙️ |
| average freight transported 🚛 | 1088 metric tons ⚙️ |
| average speed | 24 km/h ⚙️ |
2018 monitoring methods:
N/A
2018 Theoretical
EIV (Efficiency Indicator Values): 9.29 gCO₂/ton/nautical mile
﹖ details
ℹ️
Figures with the icon ⚙️ were computed based on the published data.
You can find computation details on
this page ↗
GreenFerries is a hobby project, all the data shown here has no official value. It is Open Source, so you can double check and modify it.

The Ecoscore compares
average CO₂ emissions per passenger per km.
‟emits like 2.1 planes” means that the ferry emits more than twice what an average plane would on the same distance for one passenger.