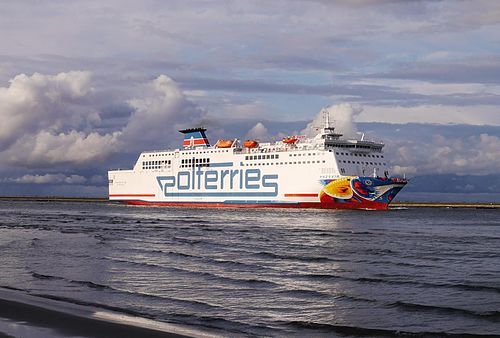
Mazovia

better than riding a car with two passengers
(based on 2022 data)
Often travels on 0 routes
⚠️
Do you know of a route that this ship frequently travels but is not listed? Or have you noticed an error?
Please help by letting us know, thank you 🙇🏽♀️
Please help by letting us know, thank you 🙇🏽♀️
Ship Statistics
| 2022 yearly CO₂ Emissions | |||
|---|---|---|---|
| assigned to | total | average | ratio |
| persons 🙎♀️ | 1386 tonnes CO₂ | 86 g·CO₂/pax/n.mile | 5 % ⚙️ |
| freight 🚛 | 25267 tonnes CO₂ | 167 kg·CO₂/m tonne/n.mile | 95 % ⚙️ |
| total | 26653 tonnes CO₂ | 411 kg·CO₂/n.mile | 100% |
| 2022 yearly statistics | |
|---|---|
| distance travelled | 120009 km ⚙️ |
| time at sea | 4622 hours |
| 2022 average statistics per journey | |
|---|---|
| average persons transported 🙎♀️ | 249 persons ⚙️ |
| average freight transported 🚛 | 2334 metric tons ⚙️ |
| average speed | 26 km/h ⚙️ |
2022 monitoring methods:
N/A
2022 Theoretical
EIV (Efficiency Indicator Values): 56.34 gCO₂/ton/nautical mile
﹖ details
| 2021 yearly CO₂ Emissions | |||
|---|---|---|---|
| assigned to | total | average | ratio |
| persons 🙎♀️ | 1355 tonnes CO₂ | 84 g·CO₂/pax/n.mile | 5 % ⚙️ |
| freight 🚛 | 24710 tonnes CO₂ | 156 kg·CO₂/m tonne/n.mile | 95 % ⚙️ |
| total | 26066 tonnes CO₂ | 413 kg·CO₂/n.mile | 100% |
| 2021 yearly statistics | |
|---|---|
| distance travelled | 116810 km ⚙️ |
| time at sea | 4628 hours |
| 2021 average statistics per journey | |
|---|---|
| average persons transported 🙎♀️ | 257 persons ⚙️ |
| average freight transported 🚛 | 2515 metric tons ⚙️ |
| average speed | 25 km/h ⚙️ |
2021 monitoring methods:
N/A
2021 Theoretical
EIV (Efficiency Indicator Values): 56.34 gCO₂/ton/nautical mile
﹖ details
| 2020 yearly CO₂ Emissions | |||
|---|---|---|---|
| assigned to | total | average | ratio |
| persons 🙎♀️ | 1411 tonnes CO₂ | 85 g·CO₂/pax/n.mile | 5 % ⚙️ |
| freight 🚛 | 25731 tonnes CO₂ | 155 kg·CO₂/m tonne/n.mile | 95 % ⚙️ |
| total | 27142 tonnes CO₂ | 412 kg·CO₂/n.mile | 100% |
| 2020 yearly statistics | |
|---|---|
| distance travelled | 122144 km ⚙️ |
| time at sea | 4911 hours |
| 2020 average statistics per journey | |
|---|---|
| average persons transported 🙎♀️ | 253 persons ⚙️ |
| average freight transported 🚛 | 2524 metric tons ⚙️ |
| average speed | 25 km/h ⚙️ |
2020 monitoring methods:
N/A
2020 Theoretical
EIV (Efficiency Indicator Values): 56.34 gCO₂/ton/nautical mile
﹖ details
| 2019 yearly CO₂ Emissions | |||
|---|---|---|---|
| assigned to | total | average | ratio |
| persons 🙎♀️ | 1227 tonnes CO₂ | 68 g·CO₂/pax/n.mile | 5 % ⚙️ |
| freight 🚛 | 25447 tonnes CO₂ | 159 kg·CO₂/m tonne/n.mile | 95 % ⚙️ |
| total | 26674 tonnes CO₂ | 406 kg·CO₂/n.mile | 100% |
| 2019 yearly statistics | |
|---|---|
| distance travelled | 121611 km ⚙️ |
| time at sea | 4675 hours |
| 2019 average statistics per journey | |
|---|---|
| average persons transported 🙎♀️ | 277 persons ⚙️ |
| average freight transported 🚛 | 2439 metric tons ⚙️ |
| average speed | 26 km/h ⚙️ |
2019 monitoring methods:
N/A
2019 Theoretical
EIV (Efficiency Indicator Values): 59.35 gCO₂/ton/nautical mile
﹖ details
| 2018 yearly CO₂ Emissions | |||
|---|---|---|---|
| assigned to | total | average | ratio |
| persons 🙎♀️ | 1324 tonnes CO₂ | N/A | 5 % ⚙️ |
| freight 🚛 | 27450 tonnes CO₂ | 130 kg·CO₂/m tonne/n.mile | 95 % ⚙️ |
| total | 28774 tonnes CO₂ | 441 kg·CO₂/n.mile | 100% |
| 2018 yearly statistics | |
|---|---|
| distance travelled | 120723 km ⚙️ |
| time at sea | 4667 hours |
| 2018 average statistics per journey | |
|---|---|
| average persons transported 🙎♀️ | N/A |
| average freight transported 🚛 | 3247 metric tons ⚙️ |
| average speed | 26 km/h ⚙️ |
2018 monitoring methods:
N/A
2018 Theoretical
EIV (Efficiency Indicator Values): 59.35 gCO₂/ton/nautical mile
﹖ details
ℹ️
Figures with the icon ⚙️ were computed based on the published data.
You can find computation details on
this page ↗
GreenFerries is a hobby project, all the data shown here has no official value. It is Open Source, so you can double check and modify it.

The Ecoscore compares
average CO₂ emissions per passenger per km.
‟emits like 2.1 planes” means that the ferry emits more than twice what an average plane would on the same distance for one passenger.