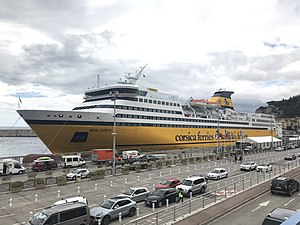
Mega Express

better than riding a car with two passengers
(based on 2021 data)
Often travels on 12 routes
- Livorno [IT] ↔ Bastia [FR] - 117 km
- Livorno [IT] ↔ Île-Rousse [FR] - 150 km
- Nice [FR] ↔ Ajaccio [FR] - 229 km
- Nice [FR] ↔ Bastia [FR] - 207 km
- Nice [FR] ↔ Île-Rousse [FR] - 178 km
- Nice [FR] ↔ Porto Vecchio [FR] - 286 km
- Savona [IT] ↔ Bastia [FR] - 192 km
- Savona [IT] ↔ Île-Rousse [FR] - 184 km
- Toulon [FR] ↔ Ajaccio [FR] - 265 km
- Toulon [FR] ↔ Bastia [FR] - 290 km
- Toulon [FR] ↔ Île-Rousse [FR] - 250 km
- Toulon [FR] ↔ Porto Vecchio [FR] - 324 km
⚠️
Do you know of a route that this ship frequently travels but is not listed? Or have you noticed an error?
Please help by letting us know, thank you 🙇🏽♀️
Please help by letting us know, thank you 🙇🏽♀️
Ship Statistics
| 2022 yearly CO₂ Emissions | |||
|---|---|---|---|
| assigned to | total | average | ratio |
| persons 🙎♀️ | N/A | N/A | N/A |
| freight 🚛 | N/A | N/A | N/A |
| total | N/A | N/A | 100% |
| 2022 yearly statistics | |
|---|---|
| distance travelled | N/A |
| time at sea | N/A |
| 2022 average statistics per journey | |
|---|---|
| average persons transported 🙎♀️ | N/A |
| average freight transported 🚛 | N/A |
| average speed | N/A |
2022 monitoring methods:
N/A
2022 Theoretical
N/A
﹖ details
| 2021 yearly CO₂ Emissions | |||
|---|---|---|---|
| assigned to | total | average | ratio |
| persons 🙎♀️ | 4984 tonnes CO₂ | 100 g·CO₂/pax/n.mile | 9 % ⚙️ |
| freight 🚛 | 50390 tonnes CO₂ | 1076 kg·CO₂/m tonne/n.mile | 91 % ⚙️ |
| total | 55373 tonnes CO₂ | 701 kg·CO₂/n.mile | 100% |
| 2021 yearly statistics | |
|---|---|
| distance travelled | 146289 km ⚙️ |
| time at sea | 4364 hours |
| 2021 average statistics per journey | |
|---|---|
| average persons transported 🙎♀️ | 631 persons ⚙️ |
| average freight transported 🚛 | 593 metric tons ⚙️ |
| average speed | 34 km/h ⚙️ |
2021 monitoring methods:
N/A
2021 Theoretical
EIV (Efficiency Indicator Values): 5.16 gCO₂/ton/nautical mile
﹖ details
| 2020 yearly CO₂ Emissions | |||
|---|---|---|---|
| assigned to | total | average | ratio |
| persons 🙎♀️ | 3887 tonnes CO₂ | 98 g·CO₂/pax/n.mile | 7 % ⚙️ |
| freight 🚛 | 51640 tonnes CO₂ | 1085 kg·CO₂/m tonne/n.mile | 93 % ⚙️ |
| total | 55526 tonnes CO₂ | 694 kg·CO₂/n.mile | 100% |
| 2020 yearly statistics | |
|---|---|
| distance travelled | 148147 km ⚙️ |
| time at sea | 4659 hours |
| 2020 average statistics per journey | |
|---|---|
| average persons transported 🙎♀️ | 498 persons ⚙️ |
| average freight transported 🚛 | 595 metric tons ⚙️ |
| average speed | 32 km/h ⚙️ |
2020 monitoring methods:
N/A
2020 Theoretical
EIV (Efficiency Indicator Values): 5.16 gCO₂/ton/nautical mile
﹖ details
| 2019 yearly CO₂ Emissions | |||
|---|---|---|---|
| assigned to | total | average | ratio |
| persons 🙎♀️ | 7860 tonnes CO₂ | 126 g·CO₂/pax/n.mile | 11 % ⚙️ |
| freight 🚛 | 63596 tonnes CO₂ | 1433 kg·CO₂/m tonne/n.mile | 89 % ⚙️ |
| total | 71456 tonnes CO₂ | 746 kg·CO₂/n.mile | 100% |
| 2019 yearly statistics | |
|---|---|
| distance travelled | 177303 km ⚙️ |
| time at sea | 4966 hours |
| 2019 average statistics per journey | |
|---|---|
| average persons transported 🙎♀️ | 649 persons ⚙️ |
| average freight transported 🚛 | 464 metric tons ⚙️ |
| average speed | 36 km/h ⚙️ |
2019 monitoring methods:
N/A
2019 Theoretical
EIV (Efficiency Indicator Values): 5.16 gCO₂/ton/nautical mile
﹖ details
| 2018 yearly CO₂ Emissions | |||
|---|---|---|---|
| assigned to | total | average | ratio |
| persons 🙎♀️ | 9026 tonnes CO₂ | 141 g·CO₂/pax/n.mile | 11 % ⚙️ |
| freight 🚛 | 73032 tonnes CO₂ | 1485 kg·CO₂/m tonne/n.mile | 89 % ⚙️ |
| total | 82058 tonnes CO₂ | 758 kg·CO₂/n.mile | 100% |
| 2018 yearly statistics | |
|---|---|
| distance travelled | 200546 km ⚙️ |
| time at sea | 5591 hours |
| 2018 average statistics per journey | |
|---|---|
| average persons transported 🙎♀️ | 593 persons ⚙️ |
| average freight transported 🚛 | 454 metric tons ⚙️ |
| average speed | 36 km/h ⚙️ |
2018 monitoring methods:
N/A
2018 Theoretical
EIV (Efficiency Indicator Values): 5.16 gCO₂/ton/nautical mile
﹖ details
ℹ️
Figures with the icon ⚙️ were computed based on the published data.
You can find computation details on
this page ↗
GreenFerries is a hobby project, all the data shown here has no official value. It is Open Source, so you can double check and modify it.

The Ecoscore compares
average CO₂ emissions per passenger per km.
‟emits like 2.1 planes” means that the ferry emits more than twice what an average plane would on the same distance for one passenger.