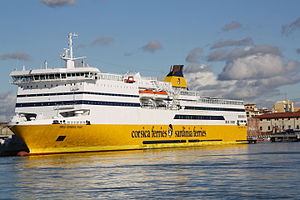
Mega Express Four

better than riding a car with two passengers
(based on 2021 data)
Often travels on 12 routes
- Livorno [IT] ↔ Bastia [FR] - 117 km
- Livorno [IT] ↔ Île-Rousse [FR] - 150 km
- Nice [FR] ↔ Ajaccio [FR] - 229 km
- Nice [FR] ↔ Bastia [FR] - 207 km
- Nice [FR] ↔ Île-Rousse [FR] - 178 km
- Nice [FR] ↔ Porto Vecchio [FR] - 286 km
- Savona [IT] ↔ Bastia [FR] - 192 km
- Savona [IT] ↔ Île-Rousse [FR] - 184 km
- Toulon [FR] ↔ Ajaccio [FR] - 265 km
- Toulon [FR] ↔ Bastia [FR] - 290 km
- Toulon [FR] ↔ Île-Rousse [FR] - 250 km
- Toulon [FR] ↔ Porto Vecchio [FR] - 324 km
⚠️
Do you know of a route that this ship frequently travels but is not listed? Or have you noticed an error?
Please help by letting us know, thank you 🙇🏽♀️
Please help by letting us know, thank you 🙇🏽♀️
Ship Statistics
| 2022 yearly CO₂ Emissions | |||
|---|---|---|---|
| assigned to | total | average | ratio |
| persons 🙎♀️ | N/A | N/A | N/A |
| freight 🚛 | N/A | N/A | N/A |
| total | N/A | N/A | 100% |
| 2022 yearly statistics | |
|---|---|
| distance travelled | N/A |
| time at sea | N/A |
| 2022 average statistics per journey | |
|---|---|
| average persons transported 🙎♀️ | N/A |
| average freight transported 🚛 | N/A |
| average speed | N/A |
2022 monitoring methods:
N/A
2022 Theoretical
N/A
﹖ details
| 2021 yearly CO₂ Emissions | |||
|---|---|---|---|
| assigned to | total | average | ratio |
| persons 🙎♀️ | 3996 tonnes CO₂ | 82 g·CO₂/pax/n.mile | 7 % ⚙️ |
| freight 🚛 | 53086 tonnes CO₂ | 890 kg·CO₂/m tonne/n.mile | 93 % ⚙️ |
| total | 57185 tonnes CO₂ | 644 kg·CO₂/n.mile | 100% |
| 2021 yearly statistics | |
|---|---|
| distance travelled | 164496 km ⚙️ |
| time at sea | 5010 hours |
| 2021 average statistics per journey | |
|---|---|
| average persons transported 🙎♀️ | 547 persons ⚙️ |
| average freight transported 🚛 | 672 metric tons ⚙️ |
| average speed | 33 km/h ⚙️ |
2021 monitoring methods:
N/A
2021 Theoretical
EIV (Efficiency Indicator Values): 5.66 gCO₂/ton/nautical mile
﹖ details
| 2020 yearly CO₂ Emissions | |||
|---|---|---|---|
| assigned to | total | average | ratio |
| persons 🙎♀️ | 2379 tonnes CO₂ | 74 g·CO₂/pax/n.mile | 6 % ⚙️ |
| freight 🚛 | 37265 tonnes CO₂ | 885 kg·CO₂/m tonne/n.mile | 94 % ⚙️ |
| total | 39644 tonnes CO₂ | 576 kg·CO₂/n.mile | 100% |
| 2020 yearly statistics | |
|---|---|
| distance travelled | 127361 km ⚙️ |
| time at sea | 4142 hours |
| 2020 average statistics per journey | |
|---|---|
| average persons transported 🙎♀️ | 466 persons ⚙️ |
| average freight transported 🚛 | 612 metric tons ⚙️ |
| average speed | 31 km/h ⚙️ |
2020 monitoring methods:
N/A
2020 Theoretical
EIV (Efficiency Indicator Values): 5.66 gCO₂/ton/nautical mile
﹖ details
| 2019 yearly CO₂ Emissions | |||
|---|---|---|---|
| assigned to | total | average | ratio |
| persons 🙎♀️ | 4432 tonnes CO₂ | 89 g·CO₂/pax/n.mile | 8 % ⚙️ |
| freight 🚛 | 50970 tonnes CO₂ | 1020 kg·CO₂/m tonne/n.mile | 92 % ⚙️ |
| total | 55402 tonnes CO₂ | 630 kg·CO₂/n.mile | 100% |
| 2019 yearly statistics | |
|---|---|
| distance travelled | 162890 km ⚙️ |
| time at sea | 4938 hours |
| 2019 average statistics per journey | |
|---|---|
| average persons transported 🙎♀️ | 566 persons ⚙️ |
| average freight transported 🚛 | 568 metric tons ⚙️ |
| average speed | 33 km/h ⚙️ |
2019 monitoring methods:
N/A
2019 Theoretical
EIV (Efficiency Indicator Values): 5.66 gCO₂/ton/nautical mile
﹖ details
| 2018 yearly CO₂ Emissions | |||
|---|---|---|---|
| assigned to | total | average | ratio |
| persons 🙎♀️ | 5327 tonnes CO₂ | 101 g·CO₂/pax/n.mile | 9 % ⚙️ |
| freight 🚛 | 53859 tonnes CO₂ | 1089 kg·CO₂/m tonne/n.mile | 91 % ⚙️ |
| total | 59186 tonnes CO₂ | 681 kg·CO₂/n.mile | 100% |
| 2018 yearly statistics | |
|---|---|
| distance travelled | 161057 km ⚙️ |
| time at sea | 4414 hours |
| 2018 average statistics per journey | |
|---|---|
| average persons transported 🙎♀️ | 609 persons ⚙️ |
| average freight transported 🚛 | 569 metric tons ⚙️ |
| average speed | 36 km/h ⚙️ |
2018 monitoring methods:
N/A
2018 Theoretical
EIV (Efficiency Indicator Values): 5.66 gCO₂/ton/nautical mile
﹖ details
ℹ️
Figures with the icon ⚙️ were computed based on the published data.
You can find computation details on
this page ↗
GreenFerries is a hobby project, all the data shown here has no official value. It is Open Source, so you can double check and modify it.

The Ecoscore compares
average CO₂ emissions per passenger per km.
‟emits like 2.1 planes” means that the ferry emits more than twice what an average plane would on the same distance for one passenger.