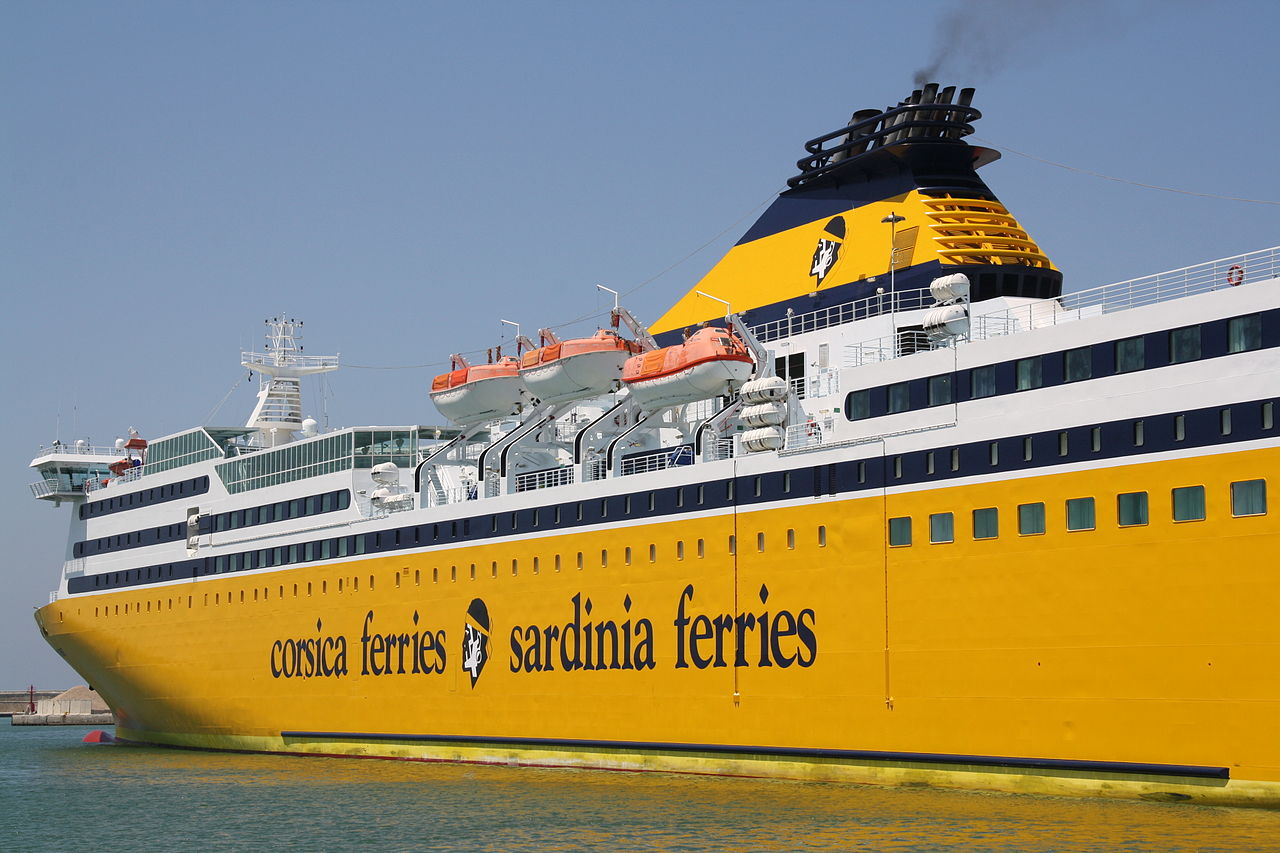
Mega Express Three

better than riding a car with two passengers
(based on 2022 data)
Often travels on 4 routes
- Nice [FR] ↔ Ajaccio [FR] - 229 km
- Nice [FR] ↔ Bastia [FR] - 207 km
- Toulon [FR] ↔ Ajaccio [FR] - 265 km
- Toulon [FR] ↔ Bastia [FR] - 290 km
⚠️
Do you know of a route that this ship frequently travels but is not listed? Or have you noticed an error?
Please help by letting us know, thank you 🙇🏽♀️
Please help by letting us know, thank you 🙇🏽♀️
Ship Statistics
| 2022 yearly CO₂ Emissions | |||
|---|---|---|---|
| assigned to | total | average | ratio |
| persons 🙎♀️ | 5302 tonnes CO₂ | 102 g·CO₂/pax/n.mile | 12 % ⚙️ |
| freight 🚛 | 38879 tonnes CO₂ | 1045 kg·CO₂/m tonne/n.mile | 88 % ⚙️ |
| total | 44181 tonnes CO₂ | 786 kg·CO₂/n.mile | 100% |
| 2022 yearly statistics | |
|---|---|
| distance travelled | 104079 km ⚙️ |
| time at sea | 2929 hours |
| 2022 average statistics per journey | |
|---|---|
| average persons transported 🙎♀️ | 924 persons ⚙️ |
| average freight transported 🚛 | 662 metric tons ⚙️ |
| average speed | 36 km/h ⚙️ |
2022 monitoring methods:
N/A
2022 Theoretical
EIV (Efficiency Indicator Values): 5.42 gCO₂/ton/nautical mile
﹖ details
| 2021 yearly CO₂ Emissions | |||
|---|---|---|---|
| assigned to | total | average | ratio |
| persons 🙎♀️ | 5242 tonnes CO₂ | 127 g·CO₂/pax/n.mile | 13 % ⚙️ |
| freight 🚛 | 35082 tonnes CO₂ | 1265 kg·CO₂/m tonne/n.mile | 87 % ⚙️ |
| total | 40603 tonnes CO₂ | 938 kg·CO₂/n.mile | 100% |
| 2021 yearly statistics | |
|---|---|
| distance travelled | 80188 km ⚙️ |
| time at sea | 2097 hours |
| 2021 average statistics per journey | |
|---|---|
| average persons transported 🙎♀️ | 953 persons ⚙️ |
| average freight transported 🚛 | 641 metric tons ⚙️ |
| average speed | 38 km/h ⚙️ |
2021 monitoring methods:
N/A
2021 Theoretical
EIV (Efficiency Indicator Values): 5.42 gCO₂/ton/nautical mile
﹖ details
| 2020 yearly CO₂ Emissions | |||
|---|---|---|---|
| assigned to | total | average | ratio |
| persons 🙎♀️ | 4091 tonnes CO₂ | 103 g·CO₂/pax/n.mile | 10 % ⚙️ |
| freight 🚛 | 36816 tonnes CO₂ | 1045 kg·CO₂/m tonne/n.mile | 90 % ⚙️ |
| total | 40906 tonnes CO₂ | 818 kg·CO₂/n.mile | 100% |
| 2020 yearly statistics | |
|---|---|
| distance travelled | 92576 km ⚙️ |
| time at sea | 2767 hours |
| 2020 average statistics per journey | |
|---|---|
| average persons transported 🙎♀️ | 796 persons ⚙️ |
| average freight transported 🚛 | 705 metric tons ⚙️ |
| average speed | 33 km/h ⚙️ |
2020 monitoring methods:
N/A
2020 Theoretical
EIV (Efficiency Indicator Values): 5.42 gCO₂/ton/nautical mile
﹖ details
| 2019 yearly CO₂ Emissions | |||
|---|---|---|---|
| assigned to | total | average | ratio |
| persons 🙎♀️ | 7055 tonnes CO₂ | 101 g·CO₂/pax/n.mile | 10 % ⚙️ |
| freight 🚛 | 63495 tonnes CO₂ | 1007 kg·CO₂/m tonne/n.mile | 90 % ⚙️ |
| total | 70551 tonnes CO₂ | 848 kg·CO₂/n.mile | 100% |
| 2019 yearly statistics | |
|---|---|
| distance travelled | 154016 km ⚙️ |
| time at sea | 4313 hours |
| 2019 average statistics per journey | |
|---|---|
| average persons transported 🙎♀️ | 843 persons ⚙️ |
| average freight transported 🚛 | 758 metric tons ⚙️ |
| average speed | 36 km/h ⚙️ |
2019 monitoring methods:
N/A
2019 Theoretical
EIV (Efficiency Indicator Values): 5.42 gCO₂/ton/nautical mile
﹖ details
| 2018 yearly CO₂ Emissions | |||
|---|---|---|---|
| assigned to | total | average | ratio |
| persons 🙎♀️ | 9032 tonnes CO₂ | 127 g·CO₂/pax/n.mile | 11 % ⚙️ |
| freight 🚛 | 73081 tonnes CO₂ | 1328 kg·CO₂/m tonne/n.mile | 89 % ⚙️ |
| total | 82113 tonnes CO₂ | 898 kg·CO₂/n.mile | 100% |
| 2018 yearly statistics | |
|---|---|
| distance travelled | 169366 km ⚙️ |
| time at sea | 4577 hours |
| 2018 average statistics per journey | |
|---|---|
| average persons transported 🙎♀️ | 780 persons ⚙️ |
| average freight transported 🚛 | 602 metric tons ⚙️ |
| average speed | 37 km/h ⚙️ |
2018 monitoring methods:
N/A
2018 Theoretical
EIV (Efficiency Indicator Values): 5.42 gCO₂/ton/nautical mile
﹖ details
ℹ️
Figures with the icon ⚙️ were computed based on the published data.
You can find computation details on
this page ↗
GreenFerries is a hobby project, all the data shown here has no official value. It is Open Source, so you can double check and modify it.

The Ecoscore compares
average CO₂ emissions per passenger per km.
‟emits like 2.1 planes” means that the ferry emits more than twice what an average plane would on the same distance for one passenger.