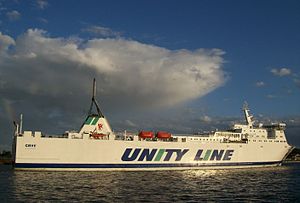
MF Gryf

over 4 times an average plane's emissions
(based on 2022 data)
Often travels on 0 routes
⚠️
Do you know of a route that this ship frequently travels but is not listed? Or have you noticed an error?
Please help by letting us know, thank you 🙇🏽♀️
Please help by letting us know, thank you 🙇🏽♀️
Ship Statistics
| 2022 yearly CO₂ Emissions | |||
|---|---|---|---|
| assigned to | total | average | ratio |
| persons 🙎♀️ | 3742 tonnes CO₂ | 3914 g·CO₂/pax/n.mile | 25 % ⚙️ |
| freight 🚛 | 11227 tonnes CO₂ | 125 kg·CO₂/m tonne/n.mile | 75 % ⚙️ |
| total | 14969 tonnes CO₂ | 261 kg·CO₂/n.mile | 100% |
| 2022 yearly statistics | |
|---|---|
| distance travelled | 106174 km ⚙️ |
| time at sea | 4287 hours |
| 2022 average statistics per journey | |
|---|---|
| average persons transported 🙎♀️ | 17 persons ⚙️ |
| average freight transported 🚛 | 1572 metric tons ⚙️ |
| average speed | 25 km/h ⚙️ |
2022 monitoring methods:
N/A
2022 Theoretical
EIV (Efficiency Indicator Values): 17.28 gCO₂/ton/nautical mile
﹖ details
| 2021 yearly CO₂ Emissions | |||
|---|---|---|---|
| assigned to | total | average | ratio |
| persons 🙎♀️ | 3650 tonnes CO₂ | 3878 g·CO₂/pax/n.mile | 25 % ⚙️ |
| freight 🚛 | 10951 tonnes CO₂ | 147 kg·CO₂/m tonne/n.mile | 75 % ⚙️ |
| total | 14601 tonnes CO₂ | 263 kg·CO₂/n.mile | 100% |
| 2021 yearly statistics | |
|---|---|
| distance travelled | 102790 km ⚙️ |
| time at sea | 4404 hours |
| 2021 average statistics per journey | |
|---|---|
| average persons transported 🙎♀️ | 17 persons ⚙️ |
| average freight transported 🚛 | 1338 metric tons ⚙️ |
| average speed | 23 km/h ⚙️ |
2021 monitoring methods:
N/A
2021 Theoretical
EIV (Efficiency Indicator Values): 17.28 gCO₂/ton/nautical mile
﹖ details
| 2020 yearly CO₂ Emissions | |||
|---|---|---|---|
| assigned to | total | average | ratio |
| persons 🙎♀️ | 4190 tonnes CO₂ | 2097 g·CO₂/pax/n.mile | 25 % ⚙️ |
| freight 🚛 | 12569 tonnes CO₂ | 81 kg·CO₂/m tonne/n.mile | 75 % ⚙️ |
| total | 16758 tonnes CO₂ | 286 kg·CO₂/n.mile | 100% |
| 2020 yearly statistics | |
|---|---|
| distance travelled | 108583 km ⚙️ |
| time at sea | 4374 hours |
| 2020 average statistics per journey | |
|---|---|
| average persons transported 🙎♀️ | 34 persons ⚙️ |
| average freight transported 🚛 | 2642 metric tons ⚙️ |
| average speed | 25 km/h ⚙️ |
2020 monitoring methods:
N/A
2020 Theoretical
EIV (Efficiency Indicator Values): 17.28 gCO₂/ton/nautical mile
﹖ details
| 2019 yearly CO₂ Emissions | |||
|---|---|---|---|
| assigned to | total | average | ratio |
| persons 🙎♀️ | 4001 tonnes CO₂ | 1874 g·CO₂/pax/n.mile | 25 % ⚙️ |
| freight 🚛 | 12004 tonnes CO₂ | 68 kg·CO₂/m tonne/n.mile | 75 % ⚙️ |
| total | 16005 tonnes CO₂ | 275 kg·CO₂/n.mile | 100% |
| 2019 yearly statistics | |
|---|---|
| distance travelled | 107703 km ⚙️ |
| time at sea | 4325 hours |
| 2019 average statistics per journey | |
|---|---|
| average persons transported 🙎♀️ | 37 persons ⚙️ |
| average freight transported 🚛 | 3041 metric tons ⚙️ |
| average speed | 25 km/h ⚙️ |
2019 monitoring methods:
N/A
2019 Theoretical
EIV (Efficiency Indicator Values): 17.28 gCO₂/ton/nautical mile
﹖ details
| 2018 yearly CO₂ Emissions | |||
|---|---|---|---|
| assigned to | total | average | ratio |
| persons 🙎♀️ | 4160 tonnes CO₂ | 1706 g·CO₂/pax/n.mile | 25 % ⚙️ |
| freight 🚛 | 12481 tonnes CO₂ | 60 kg·CO₂/m tonne/n.mile | 75 % ⚙️ |
| total | 16641 tonnes CO₂ | 270 kg·CO₂/n.mile | 100% |
| 2018 yearly statistics | |
|---|---|
| distance travelled | 114200 km ⚙️ |
| time at sea | 4622 hours |
| 2018 average statistics per journey | |
|---|---|
| average persons transported 🙎♀️ | 40 persons ⚙️ |
| average freight transported 🚛 | 3360 metric tons ⚙️ |
| average speed | 25 km/h ⚙️ |
2018 monitoring methods:
N/A
2018 Theoretical
EIV (Efficiency Indicator Values): 14.06 gCO₂/ton/nautical mile
﹖ details
ℹ️
Figures with the icon ⚙️ were computed based on the published data.
You can find computation details on
this page ↗
GreenFerries is a hobby project, all the data shown here has no official value. It is Open Source, so you can double check and modify it.

The Ecoscore compares
average CO₂ emissions per passenger per km.
‟emits like 2.1 planes” means that the ferry emits more than twice what an average plane would on the same distance for one passenger.