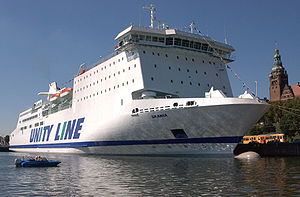
MF Skania

1 to 2 times an average plane's emissions
(based on 2022 data)
Often travels on 1 routes
- Ystad [SE] ↔ Świnoujście [PL] - 171 km
⚠️
Do you know of a route that this ship frequently travels but is not listed? Or have you noticed an error?
Please help by letting us know, thank you 🙇🏽♀️
Please help by letting us know, thank you 🙇🏽♀️
Ship Statistics
| 2022 yearly CO₂ Emissions | |||
|---|---|---|---|
| assigned to | total | average | ratio |
| persons 🙎♀️ | 7323 tonnes CO₂ | 477 g·CO₂/pax/n.mile | 25 % ⚙️ |
| freight 🚛 | 21968 tonnes CO₂ | 213 kg·CO₂/m tonne/n.mile | 75 % ⚙️ |
| total | 29291 tonnes CO₂ | 465 kg·CO₂/n.mile | 100% |
| 2022 yearly statistics | |
|---|---|
| distance travelled | 116593 km ⚙️ |
| time at sea | 4604 hours |
| 2022 average statistics per journey | |
|---|---|
| average persons transported 🙎♀️ | 244 persons ⚙️ |
| average freight transported 🚛 | 1635 metric tons ⚙️ |
| average speed | 25 km/h ⚙️ |
2022 monitoring methods:
N/A
2022 Theoretical
EIV (Efficiency Indicator Values): 24.13 gCO₂/ton/nautical mile
﹖ details
| 2021 yearly CO₂ Emissions | |||
|---|---|---|---|
| assigned to | total | average | ratio |
| persons 🙎♀️ | 8194 tonnes CO₂ | 536 g·CO₂/pax/n.mile | 25 % ⚙️ |
| freight 🚛 | 24582 tonnes CO₂ | 245 kg·CO₂/m tonne/n.mile | 75 % ⚙️ |
| total | 32776 tonnes CO₂ | 480 kg·CO₂/n.mile | 100% |
| 2021 yearly statistics | |
|---|---|
| distance travelled | 126560 km ⚙️ |
| time at sea | 5028 hours |
| 2021 average statistics per journey | |
|---|---|
| average persons transported 🙎♀️ | 224 persons ⚙️ |
| average freight transported 🚛 | 1469 metric tons ⚙️ |
| average speed | 25 km/h ⚙️ |
2021 monitoring methods:
N/A
2021 Theoretical
EIV (Efficiency Indicator Values): 24.13 gCO₂/ton/nautical mile
﹖ details
| 2020 yearly CO₂ Emissions | |||
|---|---|---|---|
| assigned to | total | average | ratio |
| persons 🙎♀️ | 7743 tonnes CO₂ | 312 g·CO₂/pax/n.mile | 25 % ⚙️ |
| freight 🚛 | 23228 tonnes CO₂ | 125 kg·CO₂/m tonne/n.mile | 75 % ⚙️ |
| total | 30971 tonnes CO₂ | 471 kg·CO₂/n.mile | 100% |
| 2020 yearly statistics | |
|---|---|
| distance travelled | 121716 km ⚙️ |
| time at sea | 4798 hours |
| 2020 average statistics per journey | |
|---|---|
| average persons transported 🙎♀️ | 378 persons ⚙️ |
| average freight transported 🚛 | 2828 metric tons ⚙️ |
| average speed | 25 km/h ⚙️ |
2020 monitoring methods:
N/A
2020 Theoretical
EIV (Efficiency Indicator Values): 24.13 gCO₂/ton/nautical mile
﹖ details
| 2019 yearly CO₂ Emissions | |||
|---|---|---|---|
| assigned to | total | average | ratio |
| persons 🙎♀️ | 7812 tonnes CO₂ | 248 g·CO₂/pax/n.mile | 25 % ⚙️ |
| freight 🚛 | 23435 tonnes CO₂ | 112 kg·CO₂/m tonne/n.mile | 75 % ⚙️ |
| total | 31247 tonnes CO₂ | 457 kg·CO₂/n.mile | 100% |
| 2019 yearly statistics | |
|---|---|
| distance travelled | 126631 km ⚙️ |
| time at sea | 5035 hours |
| 2019 average statistics per journey | |
|---|---|
| average persons transported 🙎♀️ | 460 persons ⚙️ |
| average freight transported 🚛 | 3062 metric tons ⚙️ |
| average speed | 25 km/h ⚙️ |
2019 monitoring methods:
N/A
2019 Theoretical
EIV (Efficiency Indicator Values): 24.13 gCO₂/ton/nautical mile
﹖ details
| 2018 yearly CO₂ Emissions | |||
|---|---|---|---|
| assigned to | total | average | ratio |
| persons 🙎♀️ | 7220 tonnes CO₂ | 249 g·CO₂/pax/n.mile | 25 % ⚙️ |
| freight 🚛 | 21659 tonnes CO₂ | 103 kg·CO₂/m tonne/n.mile | 75 % ⚙️ |
| total | 28879 tonnes CO₂ | 458 kg·CO₂/n.mile | 100% |
| 2018 yearly statistics | |
|---|---|
| distance travelled | 116863 km ⚙️ |
| time at sea | 4888 hours |
| 2018 average statistics per journey | |
|---|---|
| average persons transported 🙎♀️ | 459 persons ⚙️ |
| average freight transported 🚛 | 3326 metric tons ⚙️ |
| average speed | 24 km/h ⚙️ |
2018 monitoring methods:
N/A
2018 Theoretical
EIV (Efficiency Indicator Values): 24.13 gCO₂/ton/nautical mile
﹖ details
ℹ️
Figures with the icon ⚙️ were computed based on the published data.
You can find computation details on
this page ↗
GreenFerries is a hobby project, all the data shown here has no official value. It is Open Source, so you can double check and modify it.

The Ecoscore compares
average CO₂ emissions per passenger per km.
‟emits like 2.1 planes” means that the ferry emits more than twice what an average plane would on the same distance for one passenger.