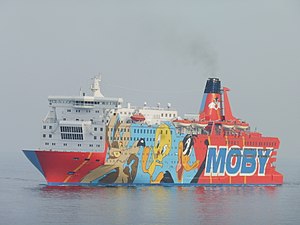
Moby Dada

over 4 times an average plane's emissions
(based on 2021 data)
Often travels on 1 routes
- Nice [FR] ↔ Bastia [FR] - 207 km
⚠️
Do you know of a route that this ship frequently travels but is not listed? Or have you noticed an error?
Please help by letting us know, thank you 🙇🏽♀️
Please help by letting us know, thank you 🙇🏽♀️
Ship Statistics
| 2022 yearly CO₂ Emissions | |||
|---|---|---|---|
| assigned to | total | average | ratio |
| persons 🙎♀️ | N/A | N/A | N/A |
| freight 🚛 | N/A | N/A | N/A |
| total | N/A | N/A | 100% |
| 2022 yearly statistics | |
|---|---|
| distance travelled | N/A |
| time at sea | N/A |
| 2022 average statistics per journey | |
|---|---|
| average persons transported 🙎♀️ | N/A |
| average freight transported 🚛 | N/A |
| average speed | N/A |
2022 monitoring methods:
N/A
2022 Theoretical
N/A
﹖ details
| 2021 yearly CO₂ Emissions | |||
|---|---|---|---|
| assigned to | total | average | ratio |
| persons 🙎♀️ | 21393 tonnes CO₂ | 1076 g·CO₂/pax/n.mile | 81 % ⚙️ |
| freight 🚛 | 5018 tonnes CO₂ | 113 kg·CO₂/m tonne/n.mile | 19 % ⚙️ |
| total | 26411 tonnes CO₂ | 716 kg·CO₂/n.mile | 100% |
| 2021 yearly statistics | |
|---|---|
| distance travelled | 68306 km ⚙️ |
| time at sea | 2307 hours |
| 2021 average statistics per journey | |
|---|---|
| average persons transported 🙎♀️ | 539 persons ⚙️ |
| average freight transported 🚛 | 1204 metric tons ⚙️ |
| average speed | 30 km/h ⚙️ |
2021 monitoring methods:
N/A
2021 Theoretical
EIV (Efficiency Indicator Values): 5.45 gCO₂/ton/nautical mile
﹖ details
| 2020 yearly CO₂ Emissions | |||
|---|---|---|---|
| assigned to | total | average | ratio |
| persons 🙎♀️ | 28527 tonnes CO₂ | 2863 g·CO₂/pax/n.mile | 79 % ⚙️ |
| freight 🚛 | 7583 tonnes CO₂ | 161 kg·CO₂/m tonne/n.mile | 21 % ⚙️ |
| total | 36110 tonnes CO₂ | 662 kg·CO₂/n.mile | 100% |
| 2020 yearly statistics | |
|---|---|
| distance travelled | 101017 km ⚙️ |
| time at sea | 3084 hours |
| 2020 average statistics per journey | |
|---|---|
| average persons transported 🙎♀️ | 183 persons ⚙️ |
| average freight transported 🚛 | 862 metric tons ⚙️ |
| average speed | 33 km/h ⚙️ |
2020 monitoring methods:
N/A
2020 Theoretical
EIV (Efficiency Indicator Values): 5.45 gCO₂/ton/nautical mile
﹖ details
| 2019 yearly CO₂ Emissions | |||
|---|---|---|---|
| assigned to | total | average | ratio |
| persons 🙎♀️ | 43887 tonnes CO₂ | 1648 g·CO₂/pax/n.mile | 86 % ⚙️ |
| freight 🚛 | 7144 tonnes CO₂ | 111 kg·CO₂/m tonne/n.mile | 14 % ⚙️ |
| total | 51031 tonnes CO₂ | 645 kg·CO₂/n.mile | 100% |
| 2019 yearly statistics | |
|---|---|
| distance travelled | 146629 km ⚙️ |
| time at sea | 4721 hours |
| 2019 average statistics per journey | |
|---|---|
| average persons transported 🙎♀️ | 336 persons ⚙️ |
| average freight transported 🚛 | 813 metric tons ⚙️ |
| average speed | 31 km/h ⚙️ |
2019 monitoring methods:
N/A
2019 Theoretical
EIV (Efficiency Indicator Values): 5.45 gCO₂/ton/nautical mile
﹖ details
| 2018 yearly CO₂ Emissions | |||
|---|---|---|---|
| assigned to | total | average | ratio |
| persons 🙎♀️ | 39611 tonnes CO₂ | 1251 g·CO₂/pax/n.mile | 96 % ⚙️ |
| freight 🚛 | 1650 tonnes CO₂ | 37 kg·CO₂/m tonne/n.mile | 4 % ⚙️ |
| total | 41262 tonnes CO₂ | 641 kg·CO₂/n.mile | 100% |
| 2018 yearly statistics | |
|---|---|
| distance travelled | 119124 km ⚙️ |
| time at sea | 3409 hours |
| 2018 average statistics per journey | |
|---|---|
| average persons transported 🙎♀️ | 492 persons ⚙️ |
| average freight transported 🚛 | 700 metric tons ⚙️ |
| average speed | 35 km/h ⚙️ |
2018 monitoring methods:
N/A
2018 Theoretical
EIV (Efficiency Indicator Values): 5.45 gCO₂/ton/nautical mile
﹖ details
ℹ️
Figures with the icon ⚙️ were computed based on the published data.
You can find computation details on
this page ↗
GreenFerries is a hobby project, all the data shown here has no official value. It is Open Source, so you can double check and modify it.

The Ecoscore compares
average CO₂ emissions per passenger per km.
‟emits like 2.1 planes” means that the ferry emits more than twice what an average plane would on the same distance for one passenger.