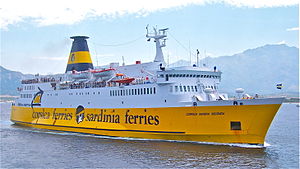
Moby Niki

over 4 times an average plane's emissions
(based on 2021 data)
Often travels on 1 routes
- Livorno [IT] ↔ Bastia [FR] - 117 km
⚠️
Do you know of a route that this ship frequently travels but is not listed? Or have you noticed an error?
Please help by letting us know, thank you 🙇🏽♀️
Please help by letting us know, thank you 🙇🏽♀️
Ship Statistics
| 2022 yearly CO₂ Emissions | |||
|---|---|---|---|
| assigned to | total | average | ratio |
| persons 🙎♀️ | N/A | N/A | N/A |
| freight 🚛 | N/A | N/A | N/A |
| total | N/A | N/A | 100% |
| 2022 yearly statistics | |
|---|---|
| distance travelled | N/A |
| time at sea | N/A |
| 2022 average statistics per journey | |
|---|---|
| average persons transported 🙎♀️ | N/A |
| average freight transported 🚛 | N/A |
| average speed | N/A |
2022 monitoring methods:
N/A
2022 Theoretical
N/A
﹖ details
| 2021 yearly CO₂ Emissions | |||
|---|---|---|---|
| assigned to | total | average | ratio |
| persons 🙎♀️ | 6785 tonnes CO₂ | 2036 g·CO₂/pax/n.mile | 85 % ⚙️ |
| freight 🚛 | 1235 tonnes CO₂ | 304 kg·CO₂/m tonne/n.mile | 15 % ⚙️ |
| total | 8020 tonnes CO₂ | 374 kg·CO₂/n.mile | 100% |
| 2021 yearly statistics | |
|---|---|
| distance travelled | 39701 km ⚙️ |
| time at sea | 1582 hours |
| 2021 average statistics per journey | |
|---|---|
| average persons transported 🙎♀️ | 155 persons ⚙️ |
| average freight transported 🚛 | 190 metric tons ⚙️ |
| average speed | 25 km/h ⚙️ |
2021 monitoring methods:
N/A
2021 Theoretical
EIV (Efficiency Indicator Values): 7.61 gCO₂/ton/nautical mile
﹖ details
| 2020 yearly CO₂ Emissions | |||
|---|---|---|---|
| assigned to | total | average | ratio |
| persons 🙎♀️ | 6478 tonnes CO₂ | 2060 g·CO₂/pax/n.mile | 83 % ⚙️ |
| freight 🚛 | 1280 tonnes CO₂ | 334 kg·CO₂/m tonne/n.mile | 17 % ⚙️ |
| total | 7758 tonnes CO₂ | 334 kg·CO₂/n.mile | 100% |
| 2020 yearly statistics | |
|---|---|
| distance travelled | 43035 km ⚙️ |
| time at sea | 1778 hours |
| 2020 average statistics per journey | |
|---|---|
| average persons transported 🙎♀️ | 135 persons ⚙️ |
| average freight transported 🚛 | 165 metric tons ⚙️ |
| average speed | 24 km/h ⚙️ |
2020 monitoring methods:
N/A
2020 Theoretical
EIV (Efficiency Indicator Values): 7.61 gCO₂/ton/nautical mile
﹖ details
| 2019 yearly CO₂ Emissions | |||
|---|---|---|---|
| assigned to | total | average | ratio |
| persons 🙎♀️ | 6644 tonnes CO₂ | 1805 g·CO₂/pax/n.mile | 85 % ⚙️ |
| freight 🚛 | 1163 tonnes CO₂ | 282 kg·CO₂/m tonne/n.mile | 15 % ⚙️ |
| total | 7807 tonnes CO₂ | 297 kg·CO₂/n.mile | 100% |
| 2019 yearly statistics | |
|---|---|
| distance travelled | 48672 km ⚙️ |
| time at sea | 2105 hours |
| 2019 average statistics per journey | |
|---|---|
| average persons transported 🙎♀️ | 140 persons ⚙️ |
| average freight transported 🚛 | 157 metric tons ⚙️ |
| average speed | 23 km/h ⚙️ |
2019 monitoring methods:
N/A
2019 Theoretical
EIV (Efficiency Indicator Values): 7.61 gCO₂/ton/nautical mile
﹖ details
| 2018 yearly CO₂ Emissions | |||
|---|---|---|---|
| assigned to | total | average | ratio |
| persons 🙎♀️ | 6906 tonnes CO₂ | 2596 g·CO₂/pax/n.mile | 87 % ⚙️ |
| freight 🚛 | 1032 tonnes CO₂ | 242 kg·CO₂/m tonne/n.mile | 13 % ⚙️ |
| total | 7938 tonnes CO₂ | 306 kg·CO₂/n.mile | 100% |
| 2018 yearly statistics | |
|---|---|
| distance travelled | 48019 km ⚙️ |
| time at sea | 2125 hours |
| 2018 average statistics per journey | |
|---|---|
| average persons transported 🙎♀️ | 103 persons ⚙️ |
| average freight transported 🚛 | 165 metric tons ⚙️ |
| average speed | 23 km/h ⚙️ |
2018 monitoring methods:
N/A
2018 Theoretical
EIV (Efficiency Indicator Values): 7.61 gCO₂/ton/nautical mile
﹖ details
ℹ️
Figures with the icon ⚙️ were computed based on the published data.
You can find computation details on
this page ↗
GreenFerries is a hobby project, all the data shown here has no official value. It is Open Source, so you can double check and modify it.

The Ecoscore compares
average CO₂ emissions per passenger per km.
‟emits like 2.1 planes” means that the ferry emits more than twice what an average plane would on the same distance for one passenger.