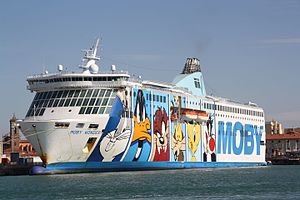
Moby Wonder

2 to 4 times an average plane's emissions
(based on 2022 data)
Often travels on 2 routes
- Livorno [IT] ↔ Olbia [IT] - 299 km
- Piombino [IT] ↔ Olbia [IT] - 238 km
⚠️
Do you know of a route that this ship frequently travels but is not listed? Or have you noticed an error?
Please help by letting us know, thank you 🙇🏽♀️
Please help by letting us know, thank you 🙇🏽♀️
Ship Statistics
| 2022 yearly CO₂ Emissions | |||
|---|---|---|---|
| assigned to | total | average | ratio |
| persons 🙎♀️ | 53957 tonnes CO₂ | 560 g·CO₂/pax/n.mile | 78 % ⚙️ |
| freight 🚛 | 14954 tonnes CO₂ | 32 kg·CO₂/m tonne/n.mile | 22 % ⚙️ |
| total | 68911 tonnes CO₂ | 809 kg·CO₂/n.mile | 100% |
| 2022 yearly statistics | |
|---|---|
| distance travelled | 157791 km ⚙️ |
| time at sea | 4334 hours |
| 2022 average statistics per journey | |
|---|---|
| average persons transported 🙎♀️ | 1132 persons ⚙️ |
| average freight transported 🚛 | 5485 metric tons ⚙️ |
| average speed | 36 km/h ⚙️ |
2022 monitoring methods:
N/A
2022 Theoretical
EIV (Efficiency Indicator Values): 4.21 gCO₂/ton/nautical mile
﹖ details
| 2021 yearly CO₂ Emissions | |||
|---|---|---|---|
| assigned to | total | average | ratio |
| persons 🙎♀️ | 54362 tonnes CO₂ | 543 g·CO₂/pax/n.mile | 81 % ⚙️ |
| freight 🚛 | 13168 tonnes CO₂ | 32 kg·CO₂/m tonne/n.mile | 19 % ⚙️ |
| total | 67530 tonnes CO₂ | 821 kg·CO₂/n.mile | 100% |
| 2021 yearly statistics | |
|---|---|
| distance travelled | 152302 km ⚙️ |
| time at sea | 4001 hours |
| 2021 average statistics per journey | |
|---|---|
| average persons transported 🙎♀️ | 1217 persons ⚙️ |
| average freight transported 🚛 | 5075 metric tons ⚙️ |
| average speed | 38 km/h ⚙️ |
2021 monitoring methods:
N/A
2021 Theoretical
EIV (Efficiency Indicator Values): 4.21 gCO₂/ton/nautical mile
﹖ details
| 2020 yearly CO₂ Emissions | |||
|---|---|---|---|
| assigned to | total | average | ratio |
| persons 🙎♀️ | 47584 tonnes CO₂ | 680 g·CO₂/pax/n.mile | 82 % ⚙️ |
| freight 🚛 | 10234 tonnes CO₂ | 49 kg·CO₂/m tonne/n.mile | 18 % ⚙️ |
| total | 57818 tonnes CO₂ | 777 kg·CO₂/n.mile | 100% |
| 2020 yearly statistics | |
|---|---|
| distance travelled | 137827 km ⚙️ |
| time at sea | 3530 hours |
| 2020 average statistics per journey | |
|---|---|
| average persons transported 🙎♀️ | 940 persons ⚙️ |
| average freight transported 🚛 | 2834 metric tons ⚙️ |
| average speed | 39 km/h ⚙️ |
2020 monitoring methods:
N/A
2020 Theoretical
EIV (Efficiency Indicator Values): 4.21 gCO₂/ton/nautical mile
﹖ details
| 2019 yearly CO₂ Emissions | |||
|---|---|---|---|
| assigned to | total | average | ratio |
| persons 🙎♀️ | 68261 tonnes CO₂ | 991 g·CO₂/pax/n.mile | 89 % ⚙️ |
| freight 🚛 | 8870 tonnes CO₂ | 72 kg·CO₂/m tonne/n.mile | 11 % ⚙️ |
| total | 77131 tonnes CO₂ | 798 kg·CO₂/n.mile | 100% |
| 2019 yearly statistics | |
|---|---|
| distance travelled | 178985 km ⚙️ |
| time at sea | 4584 hours |
| 2019 average statistics per journey | |
|---|---|
| average persons transported 🙎♀️ | 713 persons ⚙️ |
| average freight transported 🚛 | 1273 metric tons ⚙️ |
| average speed | 39 km/h ⚙️ |
2019 monitoring methods:
N/A
2019 Theoretical
EIV (Efficiency Indicator Values): 4.21 gCO₂/ton/nautical mile
﹖ details
| 2018 yearly CO₂ Emissions | |||
|---|---|---|---|
| assigned to | total | average | ratio |
| persons 🙎♀️ | 71072 tonnes CO₂ | 971 g·CO₂/pax/n.mile | 86 % ⚙️ |
| freight 🚛 | 11763 tonnes CO₂ | 87 kg·CO₂/m tonne/n.mile | 14 % ⚙️ |
| total | 82835 tonnes CO₂ | 801 kg·CO₂/n.mile | 100% |
| 2018 yearly statistics | |
|---|---|
| distance travelled | 191480 km ⚙️ |
| time at sea | 4903 hours |
| 2018 average statistics per journey | |
|---|---|
| average persons transported 🙎♀️ | 708 persons ⚙️ |
| average freight transported 🚛 | 1307 metric tons ⚙️ |
| average speed | 39 km/h ⚙️ |
2018 monitoring methods:
N/A
2018 Theoretical
EIV (Efficiency Indicator Values): 4.21 gCO₂/ton/nautical mile
﹖ details
ℹ️
Figures with the icon ⚙️ were computed based on the published data.
You can find computation details on
this page ↗
GreenFerries is a hobby project, all the data shown here has no official value. It is Open Source, so you can double check and modify it.

The Ecoscore compares
average CO₂ emissions per passenger per km.
‟emits like 2.1 planes” means that the ferry emits more than twice what an average plane would on the same distance for one passenger.