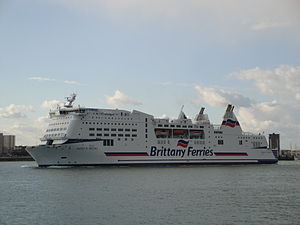
Mont St Michel

over 4 times an average plane's emissions
(based on 2022 data)
Often travels on 1 routes
⚠️
Do you know of a route that this ship frequently travels but is not listed? Or have you noticed an error?
Please help by letting us know, thank you 🙇🏽♀️
Please help by letting us know, thank you 🙇🏽♀️
Ship Statistics
| 2022 yearly CO₂ Emissions | |||
|---|---|---|---|
| assigned to | total | average | ratio |
| persons 🙎♀️ | 43987 tonnes CO₂ | 1182 g·CO₂/pax/n.mile | 78 % ⚙️ |
| freight 🚛 | 12526 tonnes CO₂ | 87 kg·CO₂/m tonne/n.mile | 22 % ⚙️ |
| total | 56513 tonnes CO₂ | 590 kg·CO₂/n.mile | 100% |
| 2022 yearly statistics | |
|---|---|
| distance travelled | 177273 km ⚙️ |
| time at sea | 6214 hours |
| 2022 average statistics per journey | |
|---|---|
| average persons transported 🙎♀️ | 389 persons ⚙️ |
| average freight transported 🚛 | 1510 metric tons ⚙️ |
| average speed | 29 km/h ⚙️ |
2022 monitoring methods:
N/A
2022 Theoretical
EIV (Efficiency Indicator Values): 28.65 gCO₂/ton/nautical mile
﹖ details
| 2021 yearly CO₂ Emissions | |||
|---|---|---|---|
| assigned to | total | average | ratio |
| persons 🙎♀️ | 4555 tonnes CO₂ | 286 g·CO₂/pax/n.mile | 8 % ⚙️ |
| freight 🚛 | 52997 tonnes CO₂ | 338 kg·CO₂/m tonne/n.mile | 92 % ⚙️ |
| total | 57552 tonnes CO₂ | 562 kg·CO₂/n.mile | 100% |
| 2021 yearly statistics | |
|---|---|
| distance travelled | 189616 km ⚙️ |
| time at sea | 6745 hours |
| 2021 average statistics per journey | |
|---|---|
| average persons transported 🙎♀️ | 156 persons ⚙️ |
| average freight transported 🚛 | 1529 metric tons ⚙️ |
| average speed | 28 km/h ⚙️ |
2021 monitoring methods:
N/A
2021 Theoretical
EIV (Efficiency Indicator Values): 28.65 gCO₂/ton/nautical mile
﹖ details
| 2020 yearly CO₂ Emissions | |||
|---|---|---|---|
| assigned to | total | average | ratio |
| persons 🙎♀️ | 2802 tonnes CO₂ | 190 g·CO₂/pax/n.mile | 5 % ⚙️ |
| freight 🚛 | 51302 tonnes CO₂ | 272 kg·CO₂/m tonne/n.mile | 95 % ⚙️ |
| total | 54104 tonnes CO₂ | 625 kg·CO₂/n.mile | 100% |
| 2020 yearly statistics | |
|---|---|
| distance travelled | 160399 km ⚙️ |
| time at sea | 5792 hours |
| 2020 average statistics per journey | |
|---|---|
| average persons transported 🙎♀️ | 170 persons ⚙️ |
| average freight transported 🚛 | 2177 metric tons ⚙️ |
| average speed | 28 km/h ⚙️ |
2020 monitoring methods:
N/A
2020 Theoretical
EIV (Efficiency Indicator Values): 28.65 gCO₂/ton/nautical mile
﹖ details
| 2019 yearly CO₂ Emissions | |||
|---|---|---|---|
| assigned to | total | average | ratio |
| persons 🙎♀️ | 8482 tonnes CO₂ | 184 g·CO₂/pax/n.mile | 14 % ⚙️ |
| freight 🚛 | 52463 tonnes CO₂ | 265 kg·CO₂/m tonne/n.mile | 86 % ⚙️ |
| total | 60946 tonnes CO₂ | 594 kg·CO₂/n.mile | 100% |
| 2019 yearly statistics | |
|---|---|
| distance travelled | 190134 km ⚙️ |
| time at sea | 6710 hours |
| 2019 average statistics per journey | |
|---|---|
| average persons transported 🙎♀️ | 450 persons ⚙️ |
| average freight transported 🚛 | 1928 metric tons ⚙️ |
| average speed | 28 km/h ⚙️ |
2019 monitoring methods:
N/A
2019 Theoretical
EIV (Efficiency Indicator Values): 28.65 gCO₂/ton/nautical mile
﹖ details
| 2018 yearly CO₂ Emissions | |||
|---|---|---|---|
| assigned to | total | average | ratio |
| persons 🙎♀️ | 8854 tonnes CO₂ | 196 g·CO₂/pax/n.mile | 16 % ⚙️ |
| freight 🚛 | 47610 tonnes CO₂ | 278 kg·CO₂/m tonne/n.mile | 84 % ⚙️ |
| total | 56464 tonnes CO₂ | 625 kg·CO₂/n.mile | 100% |
| 2018 yearly statistics | |
|---|---|
| distance travelled | 167438 km ⚙️ |
| time at sea | 6108 hours |
| 2018 average statistics per journey | |
|---|---|
| average persons transported 🙎♀️ | 500 persons ⚙️ |
| average freight transported 🚛 | 1894 metric tons ⚙️ |
| average speed | 27 km/h ⚙️ |
2018 monitoring methods:
N/A
2018 Theoretical
EIV (Efficiency Indicator Values): 28.65 gCO₂/ton/nautical mile
﹖ details
ℹ️
Figures with the icon ⚙️ were computed based on the published data.
You can find computation details on
this page ↗
GreenFerries is a hobby project, all the data shown here has no official value. It is Open Source, so you can double check and modify it.

The Ecoscore compares
average CO₂ emissions per passenger per km.
‟emits like 2.1 planes” means that the ferry emits more than twice what an average plane would on the same distance for one passenger.