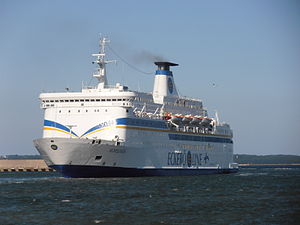
MS Almariya

1 to 2 times an average plane's emissions
(based on 2022 data)
Often travels on 1 routes
- Almeria [ES] ↔ Nador [MA] - 190 km
⚠️
Do you know of a route that this ship frequently travels but is not listed? Or have you noticed an error?
Please help by letting us know, thank you 🙇🏽♀️
Please help by letting us know, thank you 🙇🏽♀️
Ship Statistics
| 2022 yearly CO₂ Emissions | |||
|---|---|---|---|
| assigned to | total | average | ratio |
| persons 🙎♀️ | 3450 tonnes CO₂ | 372 g·CO₂/pax/n.mile | 31 % ⚙️ |
| freight 🚛 | 6071 tonnes CO₂ | 1125 kg·CO₂/m tonne/n.mile | 69 % ⚙️ |
| total | 11017 tonnes CO₂ | 476 kg·CO₂/n.mile | 100% |
| 2022 yearly statistics | |
|---|---|
| distance travelled | 42904 km ⚙️ |
| time at sea | 1923 hours |
| 2022 average statistics per journey | |
|---|---|
| average persons transported 🙎♀️ | 400 persons ⚙️ |
| average freight transported 🚛 | 233 metric tons ⚙️ |
| average speed | 22 km/h ⚙️ |
2022 monitoring methods:
N/A
2022 Theoretical
EIV (Efficiency Indicator Values): 19.79 gCO₂/ton/nautical mile
﹖ details
| 2021 yearly CO₂ Emissions | |||
|---|---|---|---|
| assigned to | total | average | ratio |
| persons 🙎♀️ | 1474 tonnes CO₂ | 4203 g·CO₂/pax/n.mile | 100 % ⚙️ |
| freight 🚛 | 1474 tonnes CO₂ | 886 kg·CO₂/m tonne/n.mile | N/A |
| total | 1474 tonnes CO₂ | 468 kg·CO₂/n.mile | 100% |
| 2021 yearly statistics | |
|---|---|
| distance travelled | 5836 km ⚙️ |
| time at sea | 280 hours |
| 2021 average statistics per journey | |
|---|---|
| average persons transported 🙎♀️ | 111 persons ⚙️ |
| average freight transported 🚛 | 528 metric tons ⚙️ |
| average speed | 21 km/h ⚙️ |
2021 monitoring methods:
N/A
2021 Theoretical
EIV (Efficiency Indicator Values): 19.79 gCO₂/ton/nautical mile
﹖ details
| 2020 yearly CO₂ Emissions | |||
|---|---|---|---|
| assigned to | total | average | ratio |
| persons 🙎♀️ | 4020 tonnes CO₂ | 20706 g·CO₂/pax/n.mile | 100 % ⚙️ |
| freight 🚛 | 4020 tonnes CO₂ | 1109 kg·CO₂/m tonne/n.mile | N/A |
| total | 4020 tonnes CO₂ | 431 kg·CO₂/n.mile | 100% |
| 2020 yearly statistics | |
|---|---|
| distance travelled | 17288 km ⚙️ |
| time at sea | 666 hours |
| 2020 average statistics per journey | |
|---|---|
| average persons transported 🙎♀️ | 21 persons ⚙️ |
| average freight transported 🚛 | 388 metric tons ⚙️ |
| average speed | 26 km/h ⚙️ |
2020 monitoring methods:
N/A
2020 Theoretical
EIV (Efficiency Indicator Values): 19.79 gCO₂/ton/nautical mile
﹖ details
| 2019 yearly CO₂ Emissions | |||
|---|---|---|---|
| assigned to | total | average | ratio |
| persons 🙎♀️ | 32679 tonnes CO₂ | 14407 g·CO₂/pax/n.mile | 100 % ⚙️ |
| freight 🚛 | 32679 tonnes CO₂ | 354 kg·CO₂/m tonne/n.mile | 0.00003060064475146618 % ⚙️ |
| total | 32679 tonnes CO₂ | 479 kg·CO₂/n.mile | 100% |
| 2019 yearly statistics | |
|---|---|
| distance travelled | 126353 km ⚙️ |
| time at sea | 5200 hours |
| 2019 average statistics per journey | |
|---|---|
| average persons transported 🙎♀️ | 33 persons ⚙️ |
| average freight transported 🚛 | 1352 metric tons ⚙️ |
| average speed | 24 km/h ⚙️ |
2019 monitoring methods:
N/A
2019 Theoretical
N/A
﹖ details
| 2018 yearly CO₂ Emissions | |||
|---|---|---|---|
| assigned to | total | average | ratio |
| persons 🙎♀️ | 27081 tonnes CO₂ | 2 g·CO₂/pax/n.mile | 100 % ⚙️ |
| freight 🚛 | 27081 tonnes CO₂ | 4 kg·CO₂/m tonne/n.mile | 0.00003692632645213578 % ⚙️ |
| total | 27081 tonnes CO₂ | 493 kg·CO₂/n.mile | 100% |
| 2018 yearly statistics | |
|---|---|
| distance travelled | 101730 km ⚙️ |
| time at sea | 3906 hours |
| 2018 average statistics per journey | |
|---|---|
| average persons transported 🙎♀️ | 202885 persons ⚙️ |
| average freight transported 🚛 | 133607 metric tons ⚙️ |
| average speed | 26 km/h ⚙️ |
2018 monitoring methods:
N/A
2018 Theoretical
N/A
﹖ details
ℹ️
Figures with the icon ⚙️ were computed based on the published data.
You can find computation details on
this page ↗
GreenFerries is a hobby project, all the data shown here has no official value. It is Open Source, so you can double check and modify it.

The Ecoscore compares
average CO₂ emissions per passenger per km.
‟emits like 2.1 planes” means that the ferry emits more than twice what an average plane would on the same distance for one passenger.