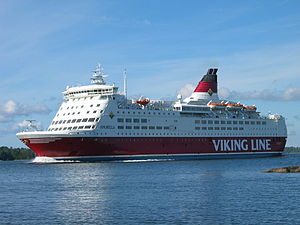
MS Amorella

better than riding a car with two passengers
(based on 2021 data)
Often travels on 2 routes
- Lumparland [AX] ↔ Stockholm [SE] - 150 km
- Turku [FI] ↔ Mariehamn [AX] - 134 km
⚠️
Do you know of a route that this ship frequently travels but is not listed? Or have you noticed an error?
Please help by letting us know, thank you 🙇🏽♀️
Please help by letting us know, thank you 🙇🏽♀️
Ship Statistics
| 2022 yearly CO₂ Emissions | |||
|---|---|---|---|
| assigned to | total | average | ratio |
| persons 🙎♀️ | N/A | N/A | N/A |
| freight 🚛 | N/A | N/A | N/A |
| total | N/A | N/A | 100% |
| 2022 yearly statistics | |
|---|---|
| distance travelled | N/A |
| time at sea | N/A |
| 2022 average statistics per journey | |
|---|---|
| average persons transported 🙎♀️ | N/A |
| average freight transported 🚛 | N/A |
| average speed | N/A |
2022 monitoring methods:
N/A
2022 Theoretical
N/A
﹖ details
| 2021 yearly CO₂ Emissions | |||
|---|---|---|---|
| assigned to | total | average | ratio |
| persons 🙎♀️ | 6550 tonnes CO₂ | 147 g·CO₂/pax/n.mile | 11 % ⚙️ |
| freight 🚛 | 49969 tonnes CO₂ | 381 kg·CO₂/m tonne/n.mile | 89 % ⚙️ |
| total | 58657 tonnes CO₂ | 489 kg·CO₂/n.mile | 100% |
| 2021 yearly statistics | |
|---|---|
| distance travelled | 222242 km ⚙️ |
| time at sea | 7587 hours |
| 2021 average statistics per journey | |
|---|---|
| average persons transported 🙎♀️ | 371 persons ⚙️ |
| average freight transported 🚛 | 1092 metric tons ⚙️ |
| average speed | 29 km/h ⚙️ |
2021 monitoring methods:
N/A
2021 Theoretical
EIV (Efficiency Indicator Values): 16 gCO₂/ton/nautical mile
﹖ details
| 2020 yearly CO₂ Emissions | |||
|---|---|---|---|
| assigned to | total | average | ratio |
| persons 🙎♀️ | 4033 tonnes CO₂ | 152 g·CO₂/pax/n.mile | 8 % ⚙️ |
| freight 🚛 | 42854 tonnes CO₂ | 379 kg·CO₂/m tonne/n.mile | 92 % ⚙️ |
| total | 48796 tonnes CO₂ | 465 kg·CO₂/n.mile | 100% |
| 2020 yearly statistics | |
|---|---|
| distance travelled | 194459 km ⚙️ |
| time at sea | 6837 hours |
| 2020 average statistics per journey | |
|---|---|
| average persons transported 🙎♀️ | 253 persons ⚙️ |
| average freight transported 🚛 | 1076 metric tons ⚙️ |
| average speed | 28 km/h ⚙️ |
2020 monitoring methods:
N/A
2020 Theoretical
EIV (Efficiency Indicator Values): 16 gCO₂/ton/nautical mile
﹖ details
| 2019 yearly CO₂ Emissions | |||
|---|---|---|---|
| assigned to | total | average | ratio |
| persons 🙎♀️ | 12604 tonnes CO₂ | 136 g·CO₂/pax/n.mile | 23 % ⚙️ |
| freight 🚛 | 40963 tonnes CO₂ | 411 kg·CO₂/m tonne/n.mile | 77 % ⚙️ |
| total | 55792 tonnes CO₂ | 473 kg·CO₂/n.mile | 100% |
| 2019 yearly statistics | |
|---|---|
| distance travelled | 218536 km ⚙️ |
| time at sea | 7543 hours |
| 2019 average statistics per journey | |
|---|---|
| average persons transported 🙎♀️ | 783 persons ⚙️ |
| average freight transported 🚛 | 845 metric tons ⚙️ |
| average speed | 29 km/h ⚙️ |
2019 monitoring methods:
N/A
2019 Theoretical
EIV (Efficiency Indicator Values): 16 gCO₂/ton/nautical mile
﹖ details
| 2018 yearly CO₂ Emissions | |||
|---|---|---|---|
| assigned to | total | average | ratio |
| persons 🙎♀️ | 12320 tonnes CO₂ | 133 g·CO₂/pax/n.mile | 23 % ⚙️ |
| freight 🚛 | 39703 tonnes CO₂ | 407 kg·CO₂/m tonne/n.mile | 77 % ⚙️ |
| total | 54273 tonnes CO₂ | 472 kg·CO₂/n.mile | 100% |
| 2018 yearly statistics | |
|---|---|
| distance travelled | 212979 km ⚙️ |
| time at sea | 7368 hours |
| 2018 average statistics per journey | |
|---|---|
| average persons transported 🙎♀️ | 803 persons ⚙️ |
| average freight transported 🚛 | 849 metric tons ⚙️ |
| average speed | 29 km/h ⚙️ |
2018 monitoring methods:
N/A
2018 Theoretical
EIV (Efficiency Indicator Values): 16 gCO₂/ton/nautical mile
﹖ details
ℹ️
Figures with the icon ⚙️ were computed based on the published data.
You can find computation details on
this page ↗
GreenFerries is a hobby project, all the data shown here has no official value. It is Open Source, so you can double check and modify it.

The Ecoscore compares
average CO₂ emissions per passenger per km.
‟emits like 2.1 planes” means that the ferry emits more than twice what an average plane would on the same distance for one passenger.